Exploring how the scheduling of FAUST's generated code impacts performances
May 5, 2025 - ⧖ 9 minThe situation
With the help of a new internal representation for code generation1, the
FAUST compiler now comes with an experimental option: -ss <N>, for scheduling
strategy. What does this mean?
This new internal representation uses a DAG (directed acyclic graph), where the nodes are all the imperative instructions needed to build the output signal from the input signals, and the vertices represent the dependencies between those instructions: if a vertex exists between instructions $i$ and $j$, it means that $j$'s result is an operand of $i$.
With this representation, the scheduling of instructions that used to be implicit in code generation becomes explicit by producing a topological ordering of this graph. A topological ordering is a sequence containing all the nodes of our graph, with the constraint that if a dependency exists between instructions $i$ and $j$ in the graph, then $i$ must appear after $j$ in the sequence.
The use of smart topological ordering has lead to significant performance improvements in the code generated by the Faust compiler: the paper linked above claims that a fairly representative set of 26 Faust programs now runs between 22% and 29% faster, depending on the ordering algorithm.
So far, 4 scheduling strategies can be tested, numbered from 0 to 3:
- Deep-first scheduling: when a node has several dependencies, the first one's entire dependency tree is scheduled before moving to the second one. By doing this, we hope that the result of a computation can be used right after it was computed, meaning that it will still be in a register of the CPU or a lower-level cache for fast access.
- Breadth-first scheduling: the graph is decomposed into stages, where the first stage contains the roots of the graph (nodes that are final results), the second stage contains the direct dependencies of those roots, the third stage contains the direct dependencies of the second stage, and so on until the leaves of the graph are reached. The algorithm then schedules all those stages in reverse order: the last stage is scheduled first. With this strategy, we're putting together computations that are unrelated. This can lead to a better use of the CPU pipeline and super-scalar vectorization, but also more cache misses since computations are scheduled further from their dependencies.
- Interleaved scheduling: like the deep-first scheduling, but when a node has several dependencies, the operations needed to compute those dependencies are interleaved between each other. This policy is kind of a compromise between the two others, and sometimes produces faster results. But the recursive interleaving operation moves a lot of data and sometimes causes the compiler to fail for big programs.
- Reverse breadth-first: like breadth-first, but reverses the order of every stage.
Measuring the differences between different strategies
Even though those strategies lead to overall improvements of the generated code
performances, for a given program, those performances can vary a lot between
different strategies. We can see this by running fcbenchtool (from the Faust
Compiler Benchmark Tools) with each scheduling strategy, for every Faust
program found in the examples/ directory of the Faust distribution, and
looking at the time ratio between the fastest and the slowest strategy for all
those programs. If we plot those time ratios by decreasing order, here's what we
get:
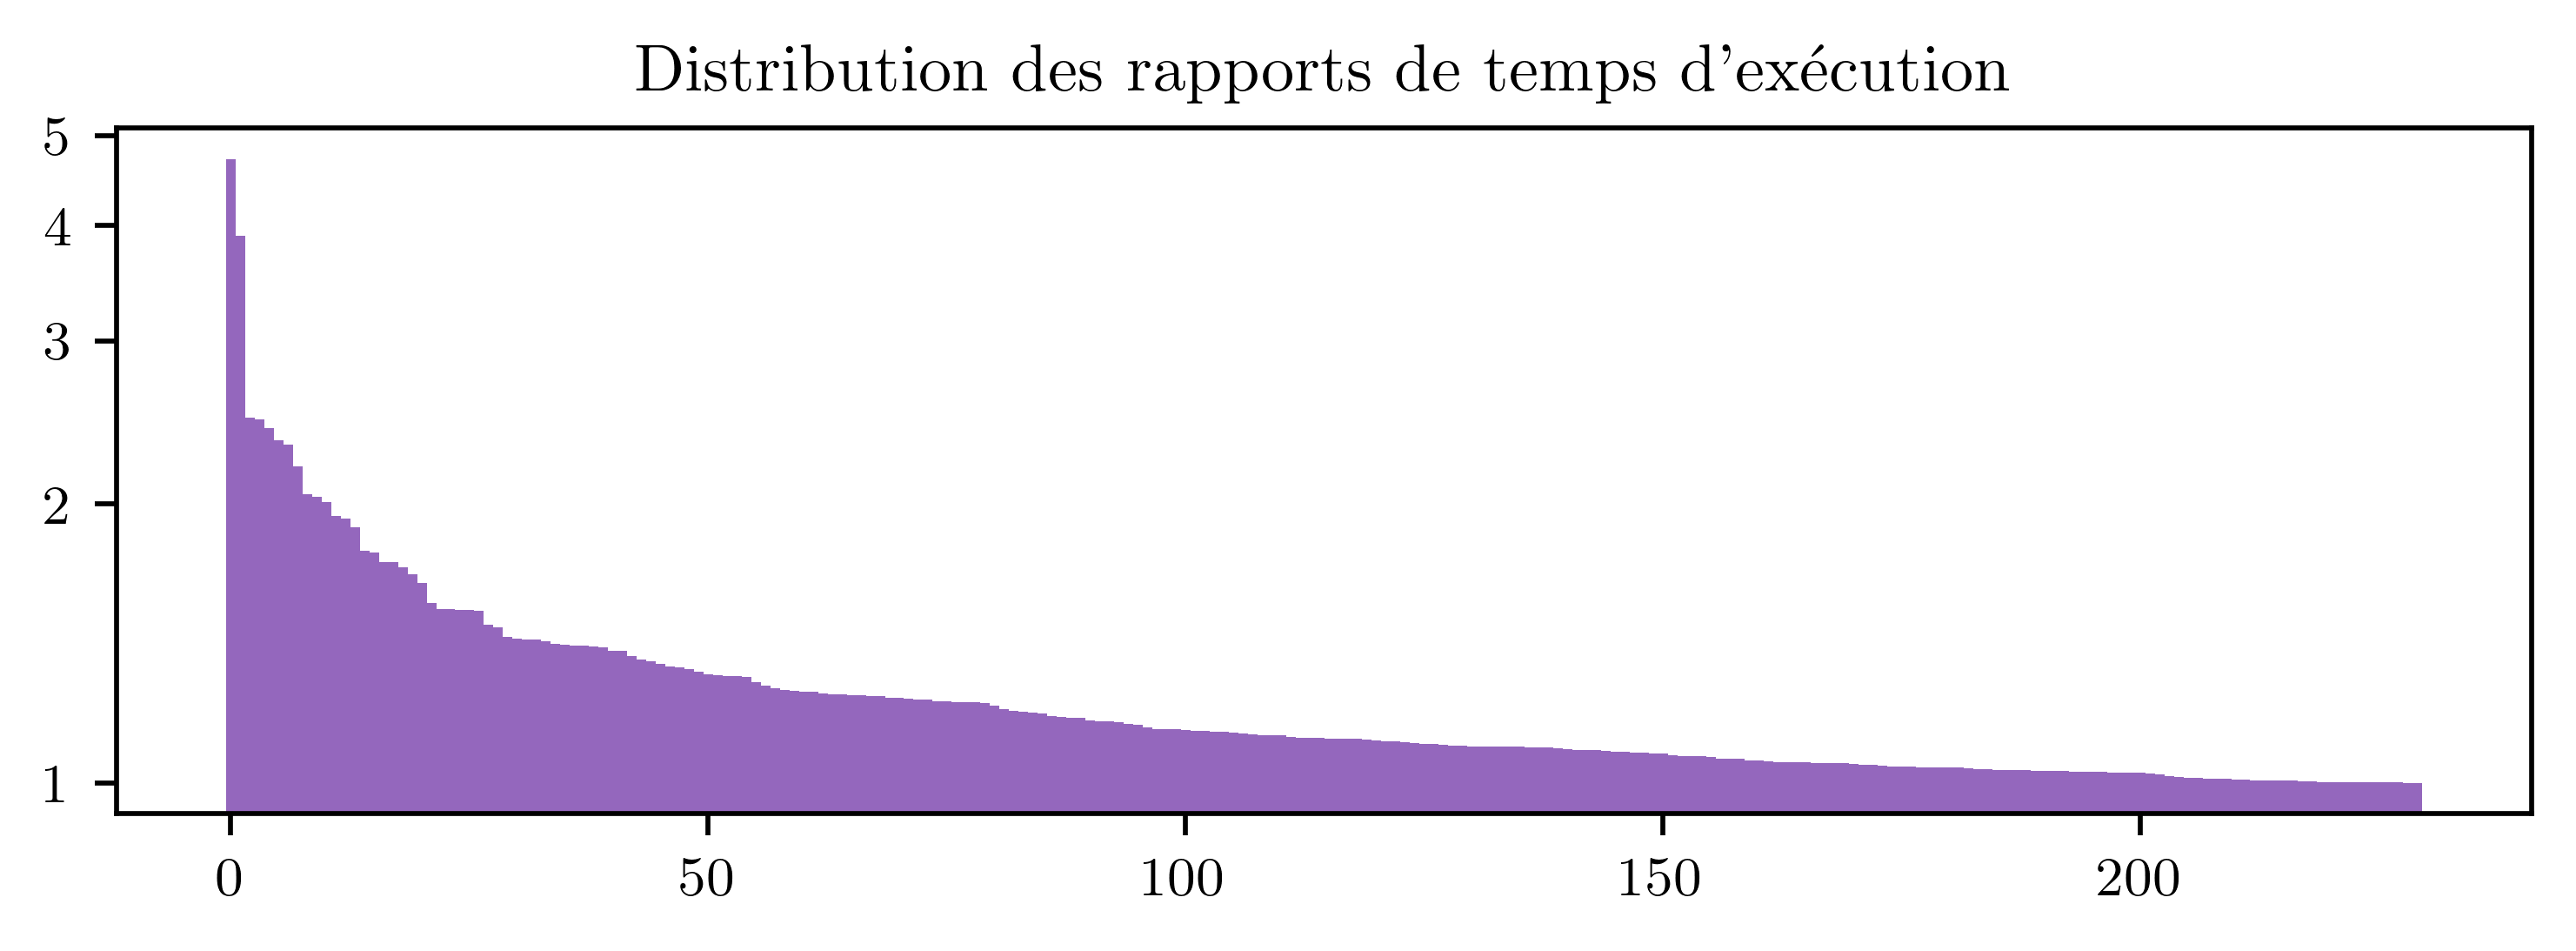
Even though those measures are far from precise (I ran them on an afternoon on my personal computer, only once, to get a glimpse of what was happening), we can feel there's a lot going on here. When building embedded synthesizers, a 5% performance gain is already a lot. Here out of 246 example programs, we measured a difference above 5% for 169 of them. 62 programs show a difference of 25% or more, and the price goes to a vocoder program, for which the interleaved strategy ran almost 5 times slower than all the others. This can't be attributed only to measure noise. Is it possible that those policies are missing something? Could we squeeze more performance out of Faust's generated by implementing smarter scheduling?
For that, we first need to understand what's really happening under the hood: what's going on with the cache? How is the C++ compiler vectorizing our code? To understand this, we're going to need a way to measure what the CPU is doing when running our DSP. Fortunately, there's a way to do exactly that.
Performance Monitoring Units to the rescue
All modern CPUs provide Performance Monitoring Units. Those are counters that can be used to collect the occurrences of various events that happen during the execution of a program 2. If you're using a Linux kernel, the libpfm gives you access to those counters. Its documentation is a bit sparse, so I thought I'd share what I came up with.
First, the basic setup for any usage of this library: include the appropriate headers, and initialize the library.
#include <perfmon/perf_event.h>
#include <perfmon/pfmlib_perf_event.h>
#include <stdio.h>

int main(int argc, char **argv) {
    int ret;

    ret = pfm_initialize();
    if (ret != PFM_SUCCESS) {
        fprintf(stderr, "Failed to initialize PFM lib: %s\n", pfm_strerror(ret));
        exit(ret);
    }

    ...

    return 0;
}
Then, among the various ways to create events, the most flexible one I found was using this function:
int pfm_get_os_event_encoding(const char *str, int dfl_plm, pfm_os_t os, void *arg);
It takes as first parameter a string describing the event we want to open. This
string is in the same format as the strings perf(1) accepts, which allows me
to open any event listed by perf list. I wrote this little function to make
its usage easier for me:
static int perf_event_open_named(const char* str, int group_fd)
{
    int                   ret;
    perf_event_attr       attr = {};
    pfm_perf_encode_arg_t arg  = {.attr = &attr, .size = sizeof(pfm_perf_encode_arg_t)};

    ret = pfm_get_os_event_encoding(str, PFM_PLM3, PFM_OS_PERF_EVENT_EXT, &arg);
    if (ret != PFM_SUCCESS) {
        fprintf(stderr, "Error opening event %s: %s\n", str, pfm_strerror(ret));
        pfm_terminate();
        exit(ret);
    }

    attr.disabled       = 1;
    attr.exclude_kernel = 1;
    attr.exclude_hv     = 1;

    return syscall(SYS_perf_event_open, &attr, 0, -1, group_fd, 0);
}
This function takes two parameters: the first one is a string describing the event (as found in perf list); the second one is a group file descriptor that is used by PFM to group events together, meaning that they will be measured together. The returned integer is a file descriptor to the event that was opened.
The first event of a group, called the leader, should be opened with a
group_fd of -1, and the other events that we want to measure together should
be opened with the file descriptor returned by the leader.
Now, if I want to count, for example, the number of L1 data cache misses during the execution of a sequence of code, here's a way to do it:
int counter = perf_event_open_named("L1-dcache-load-misses", -1);

// Reset the counter to 0 (useful if we want to use it several times in a loop)
ioctl(counter, PERF_EVENT_IOC_RESET, 0);

// Start counting
ioctl(counter, PERF_EVENT_IOC_ENABLE, 0);

// Run the function I want to measure
mydsp_compute();

// Stop counting
ioctl(counter, PERF_EVENT_IOC_DISABLE, 0);

// Read the counter value
long long count;
read(counter, &count, sizeof(long long));
printf("Number of L1D cache misses: %lld\n", count);
With this idea, I wrote a benchmarking architecture for Faust programs that take a list of perf events as parameters, runs the main loop 1000 times and prints the counts of those events. I then wrote a little set of tools in Python to analyze those results, inspired by Orlarey's benchmarking tools, and published as Faust Scheduling Tools.
What we suspected
Using this little helper, I've selected about 20 programs from the Faust examples for which the time execution differences between strategies were the most substantial, and I ran my benchmarking architecture with a set of 4 events that I found interesting:
cpu-cycles: the most basic event: just counts the number of cycles.instructions: counts the total number of instructions executed by the CPU. It's pretty precise: it gives a number of at least 7 digits that is exactly the same for every loop.cycle_activity.stalls_mem_any: counts the number of cycles elapsed without executing any instructions because the CPU is waiting for data from any level of the cache. This event is specific to the Intel Core Skylake architecture, as documented here.cycles_acitivy.stalls_total: counts the number of cycles elapsed without executing any instructions, for any reason.
So I measured those events for every scheduling policy, and to be extra careful,
I also compiled the C++ code with GCC and with Clang, and with or without the
-march=native flag. This way we can tell if the differences are an artifact of
our C++ compiler optimization or if they're a characteristic of the generated
code.
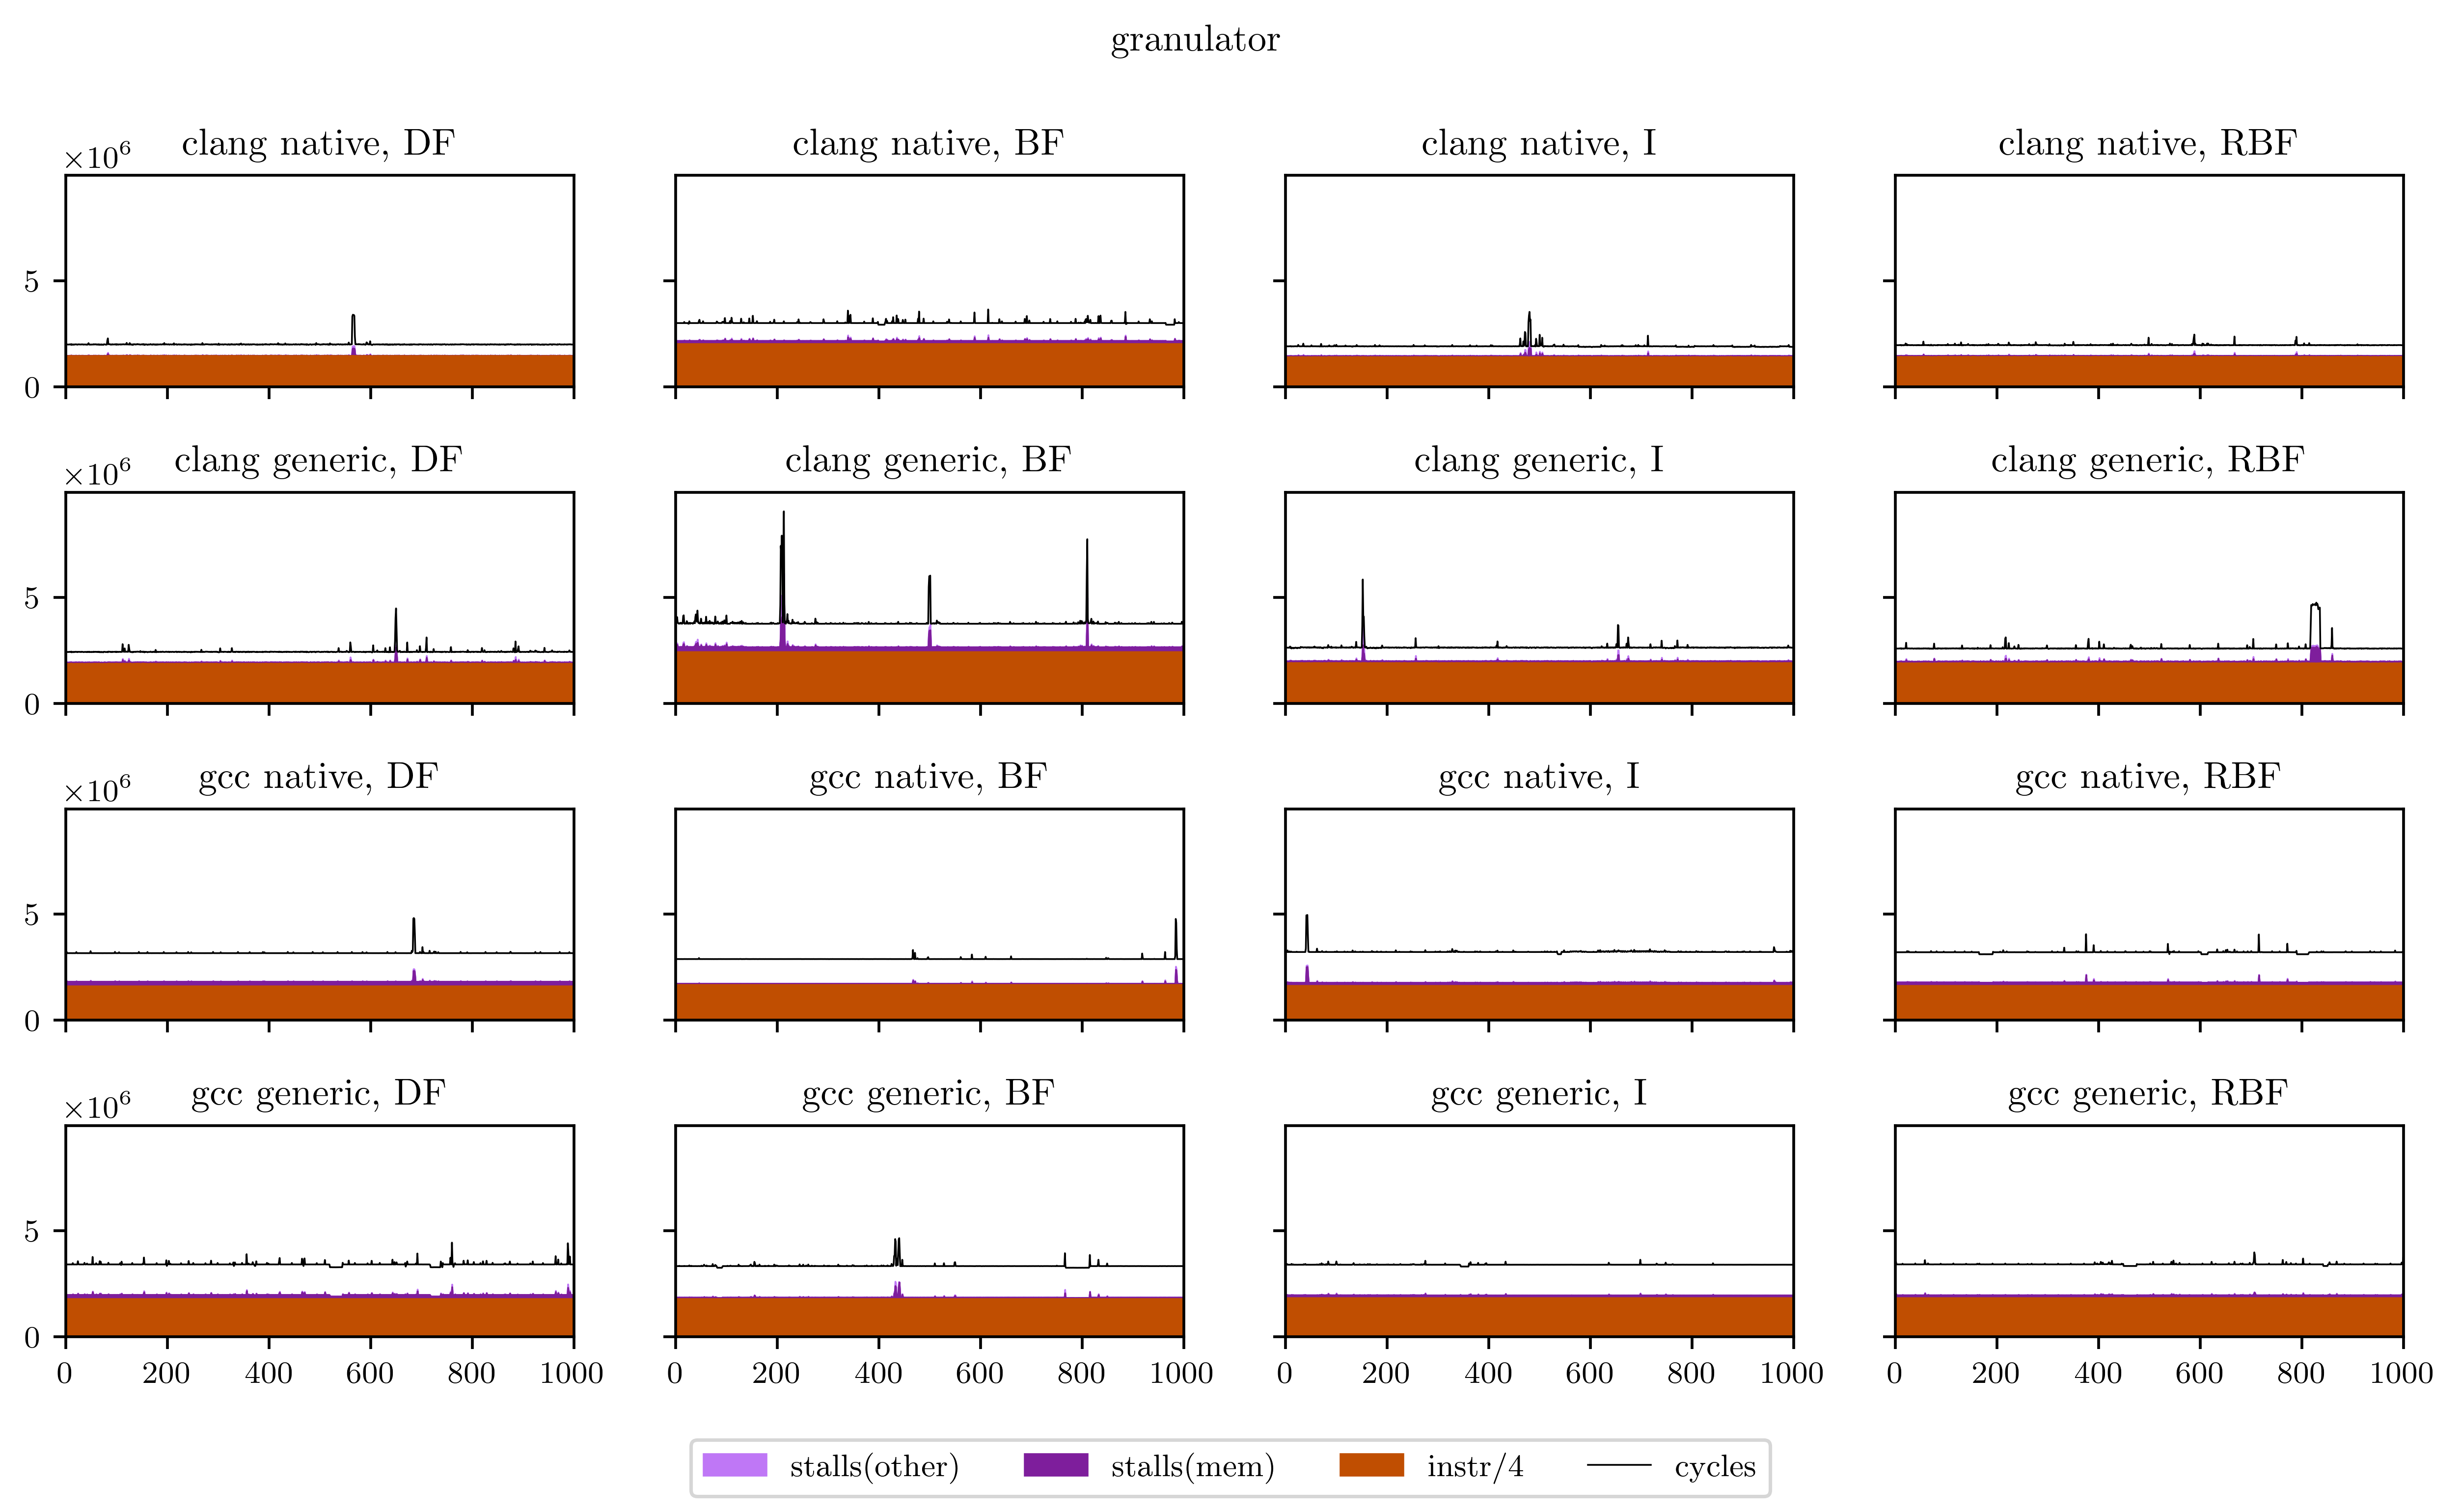
The result looks like this:
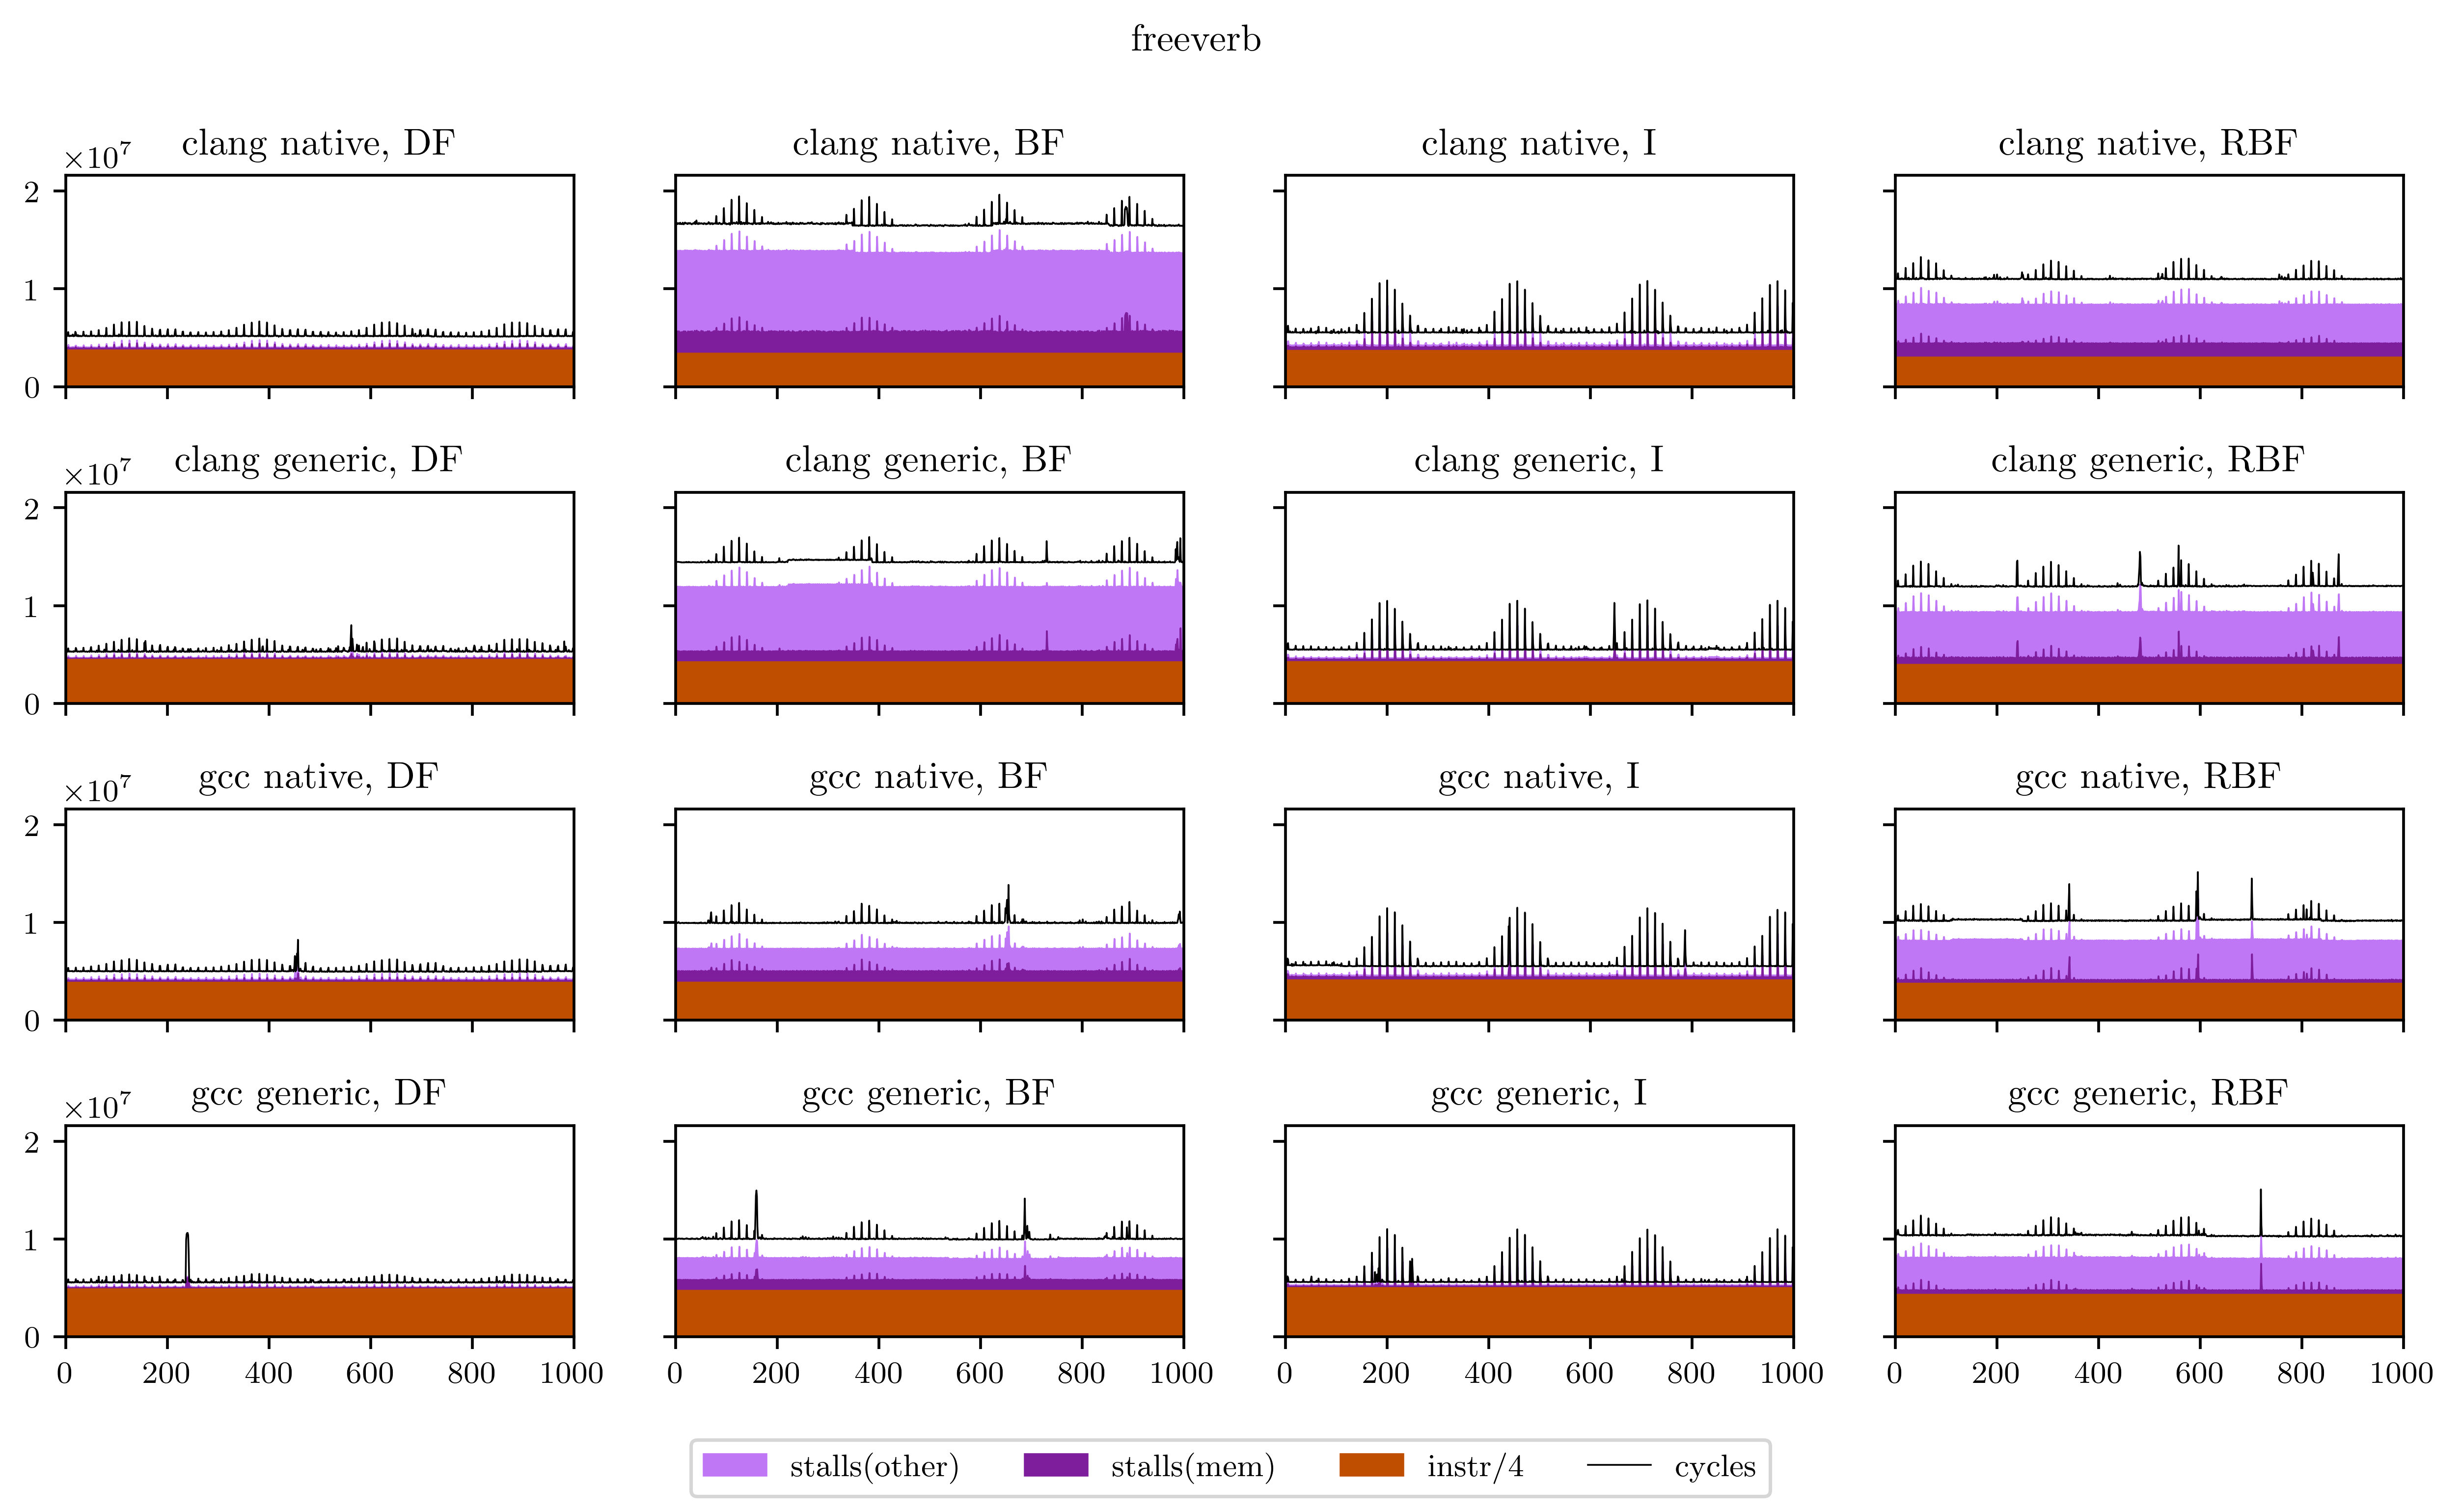
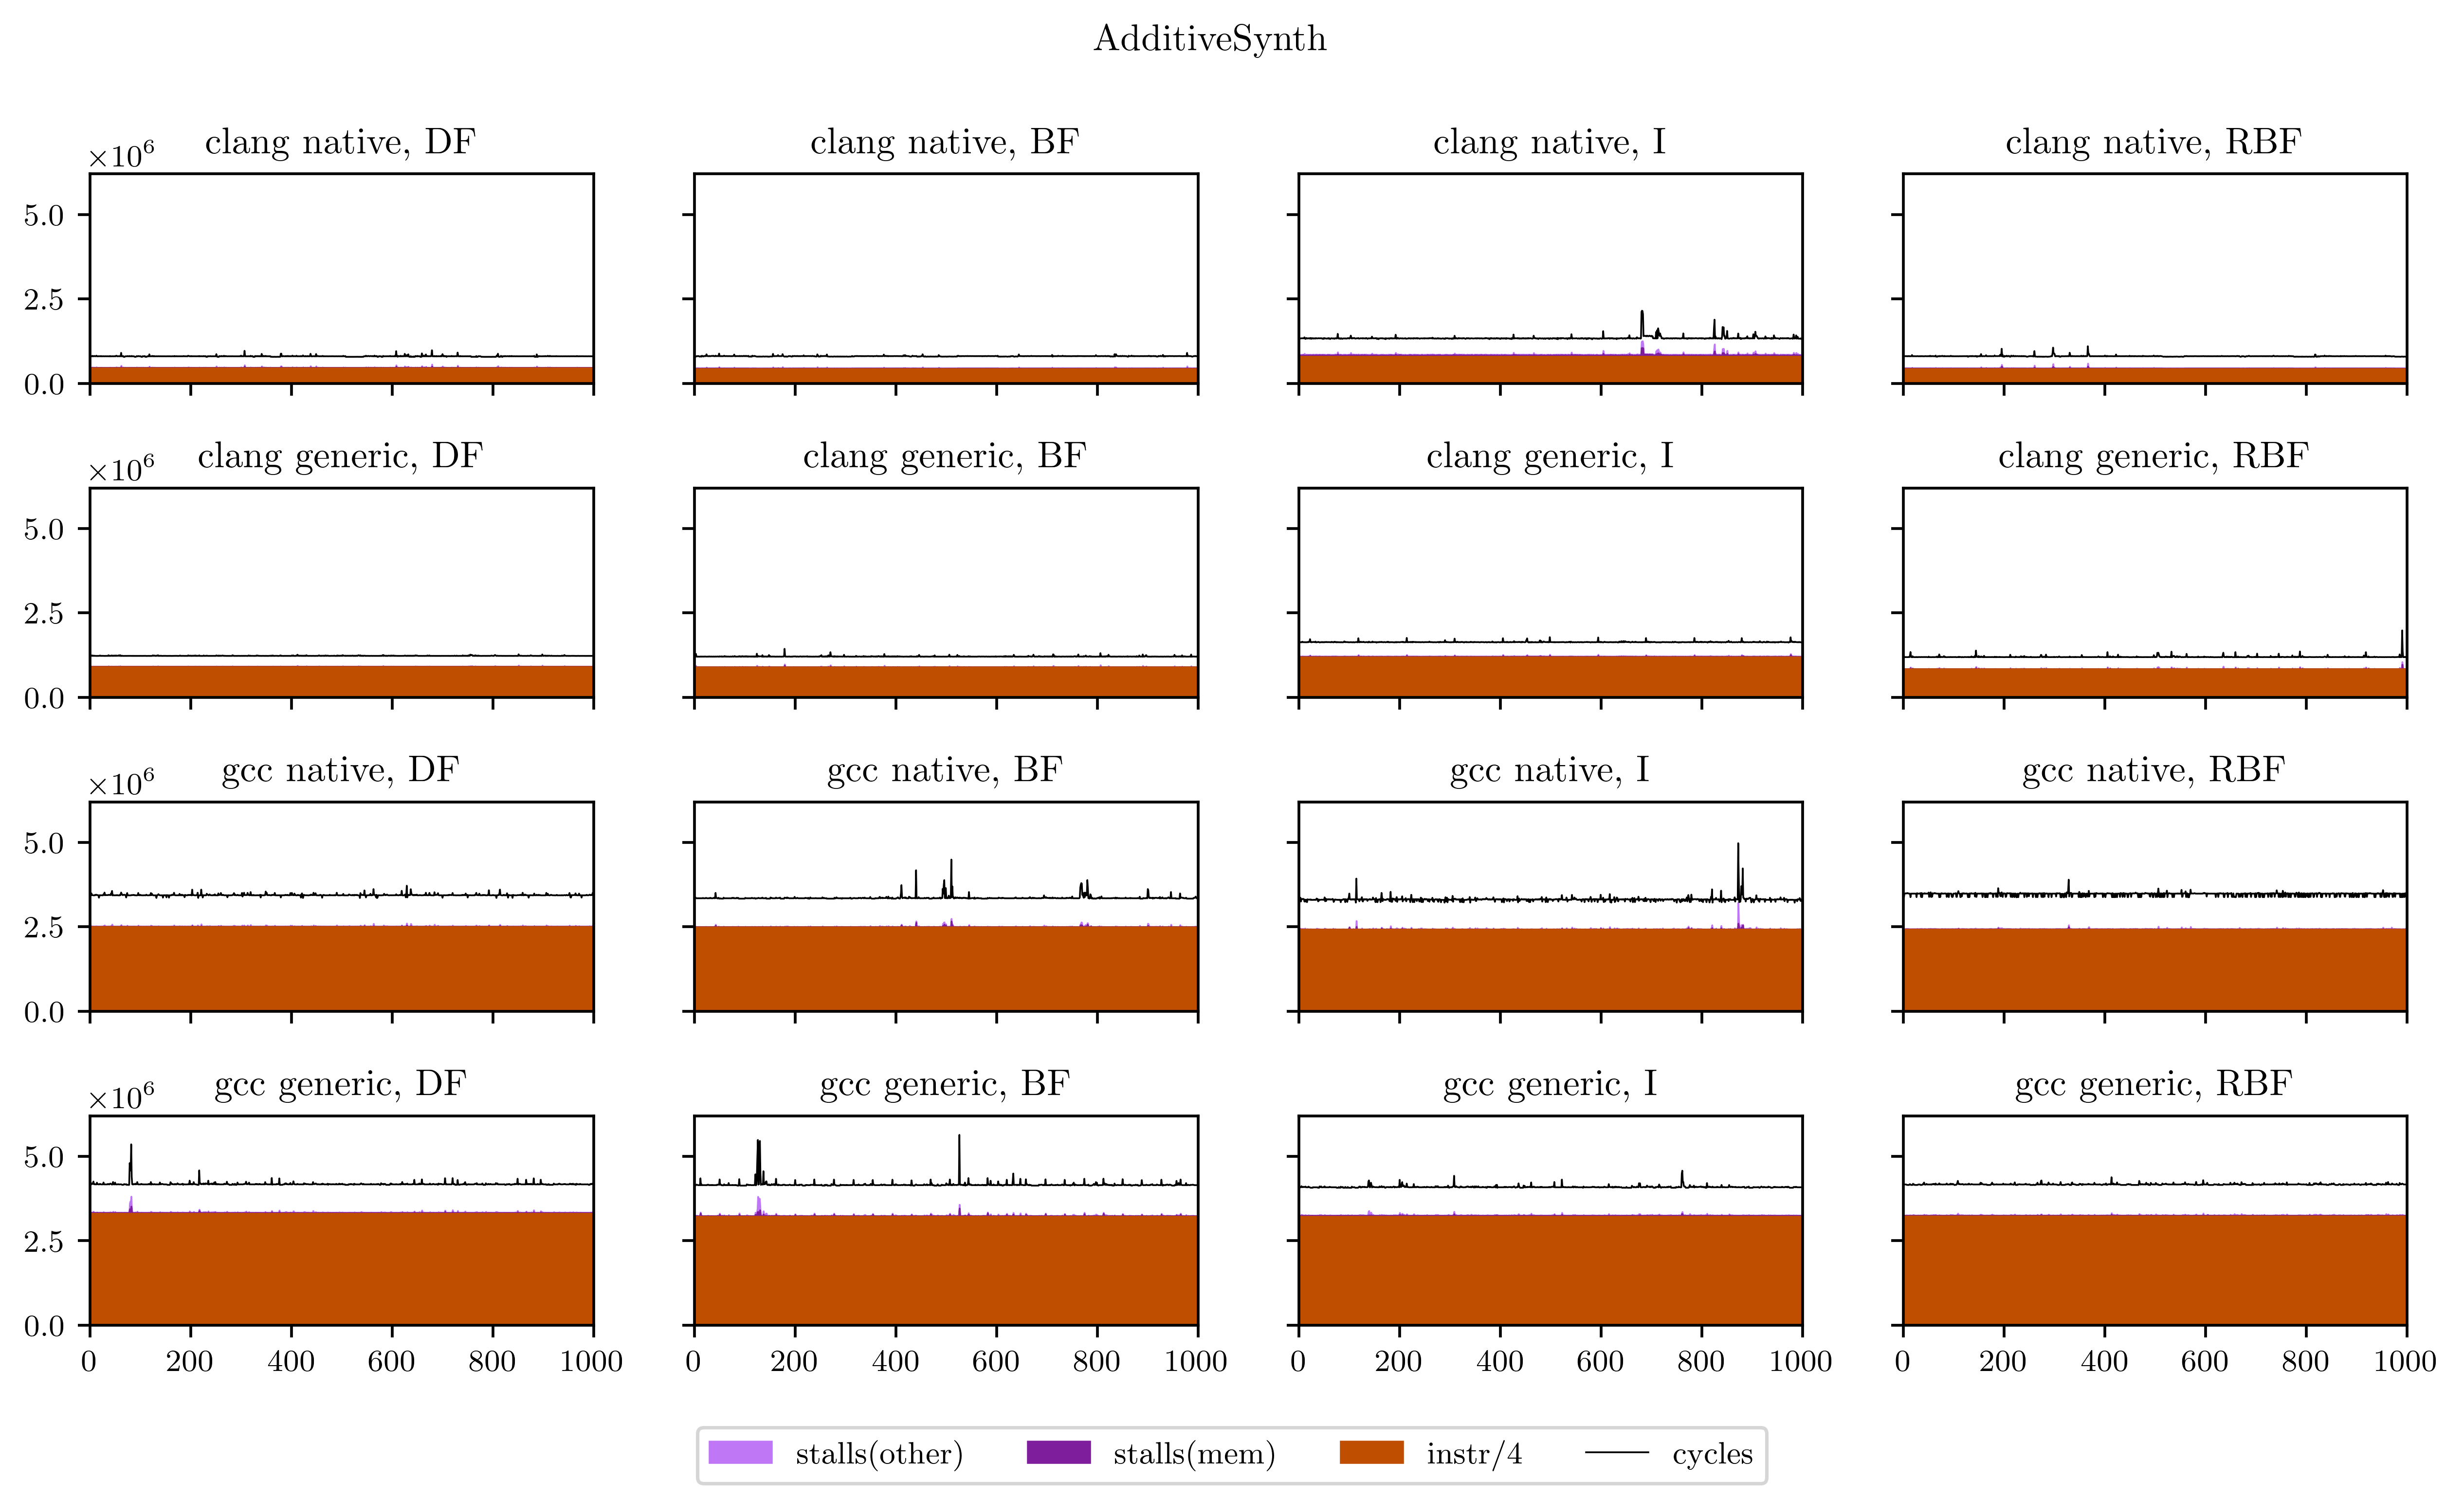
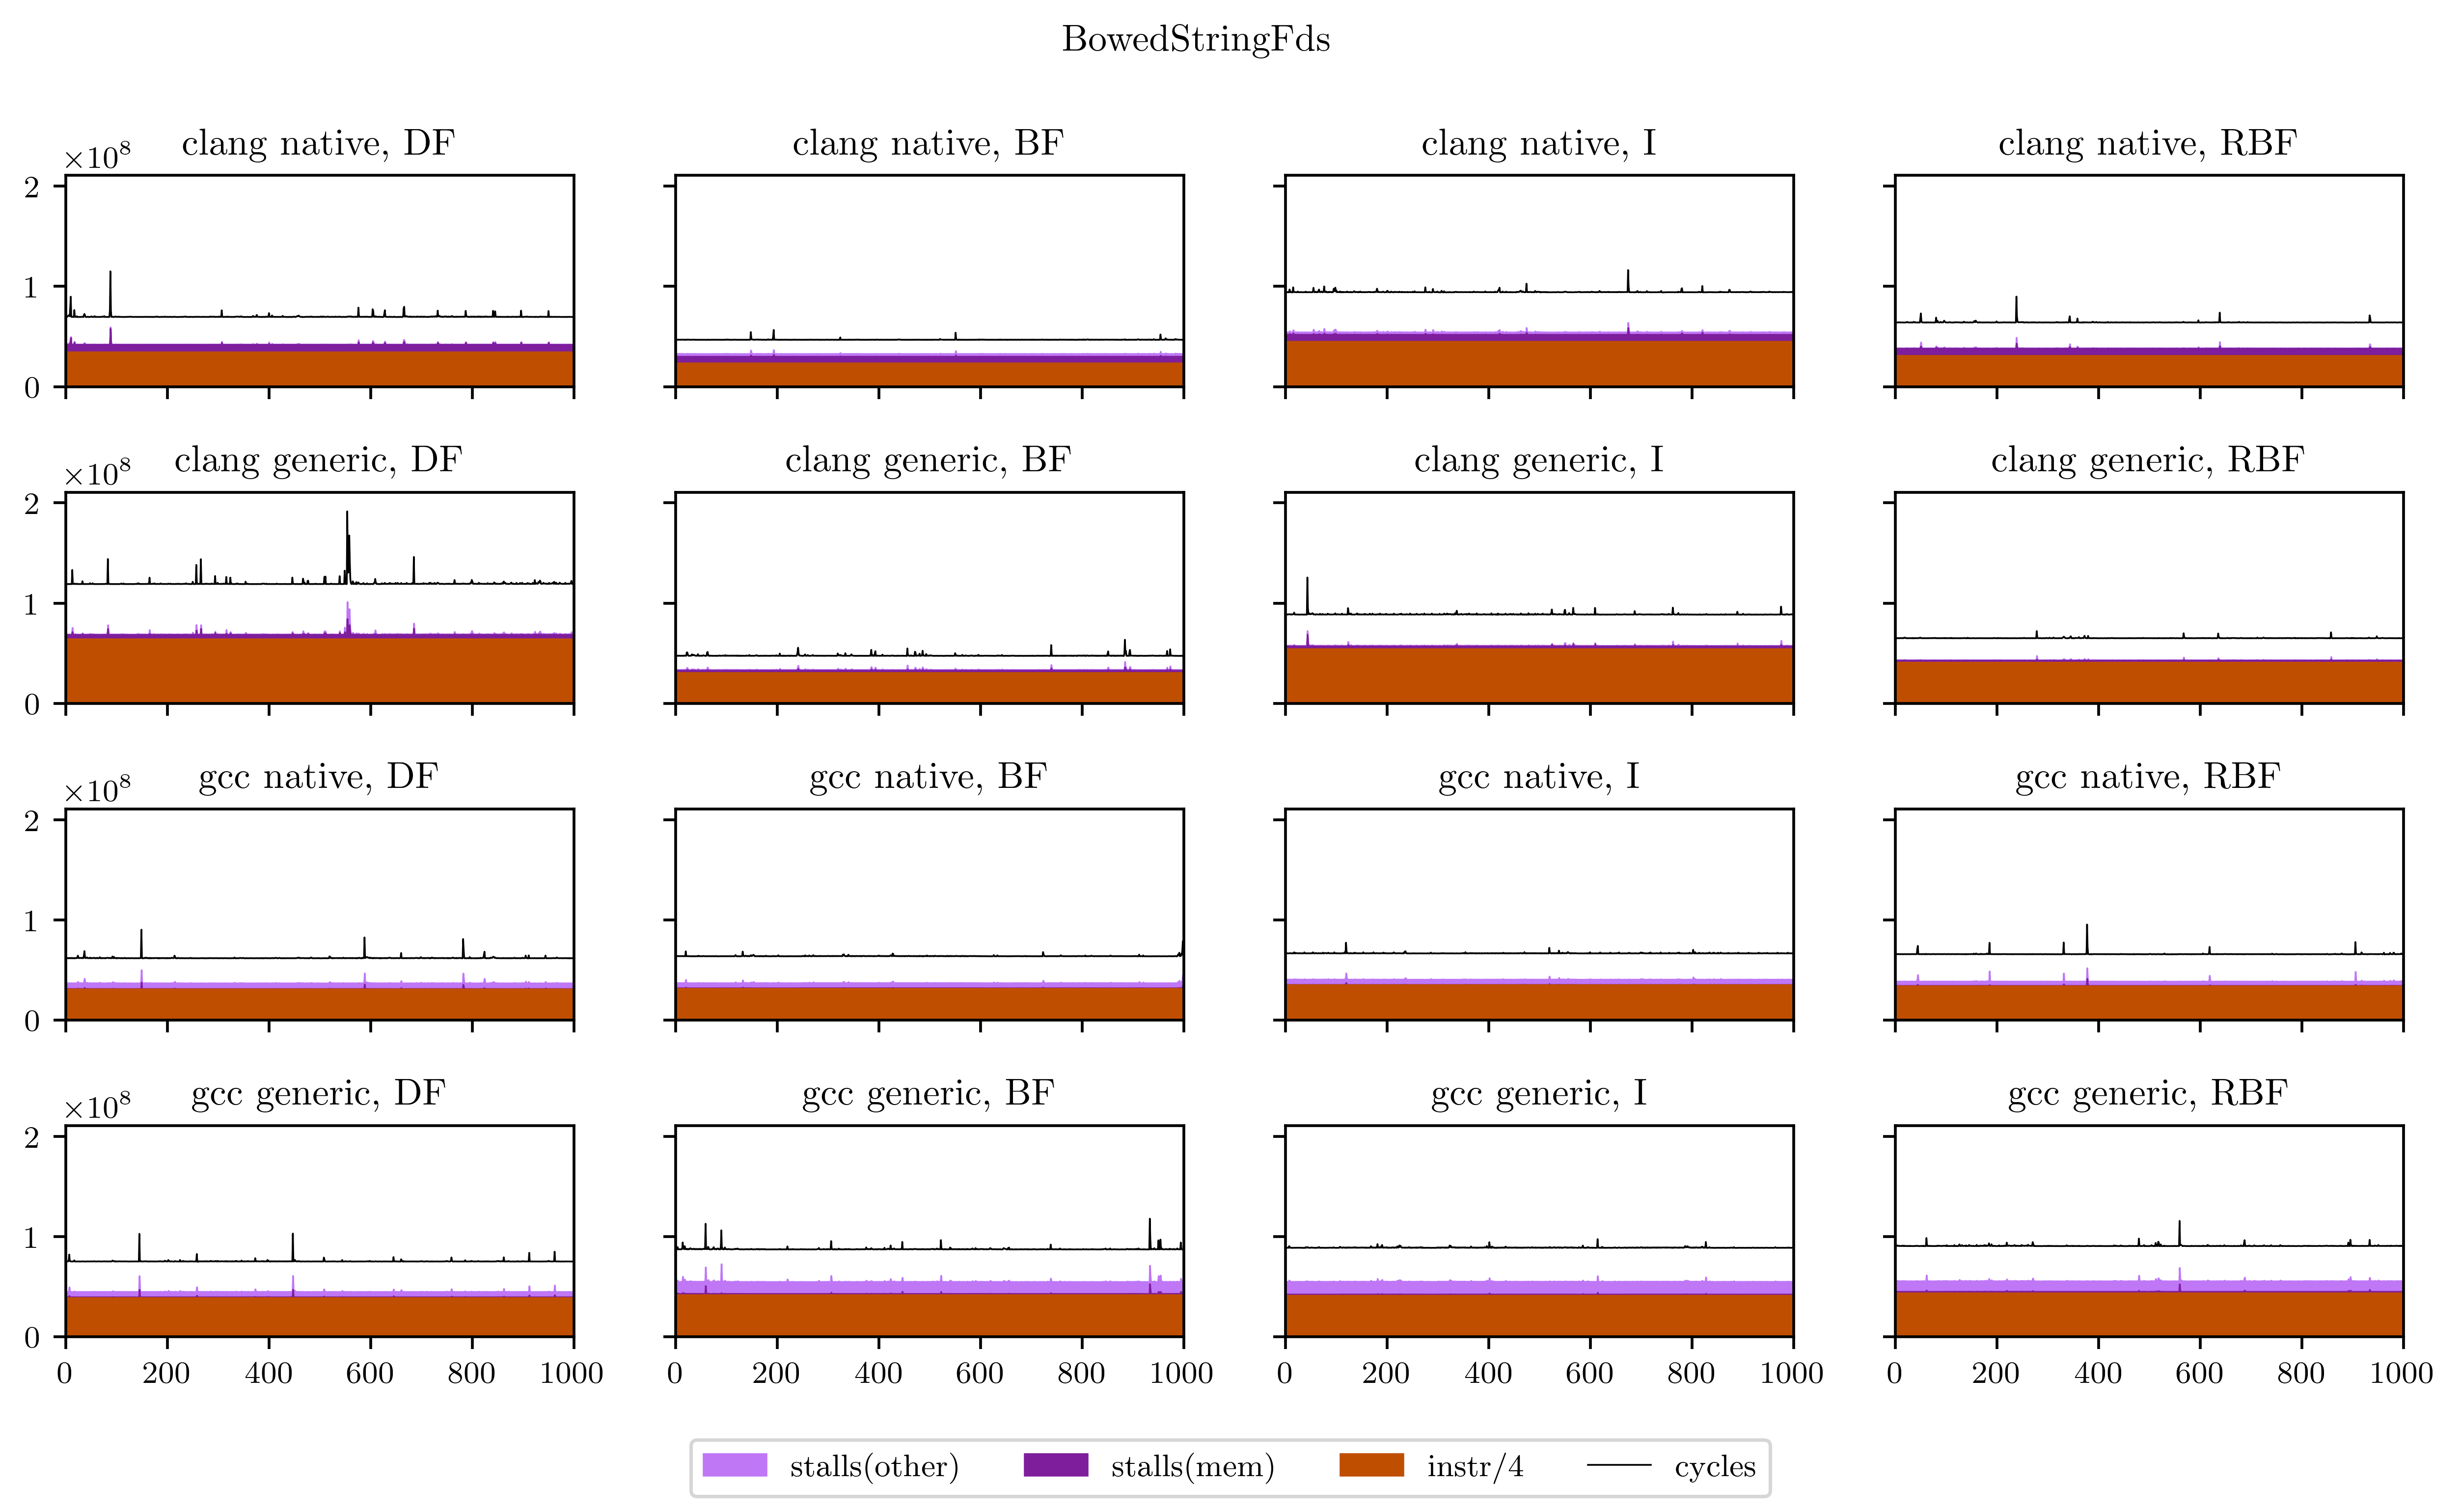
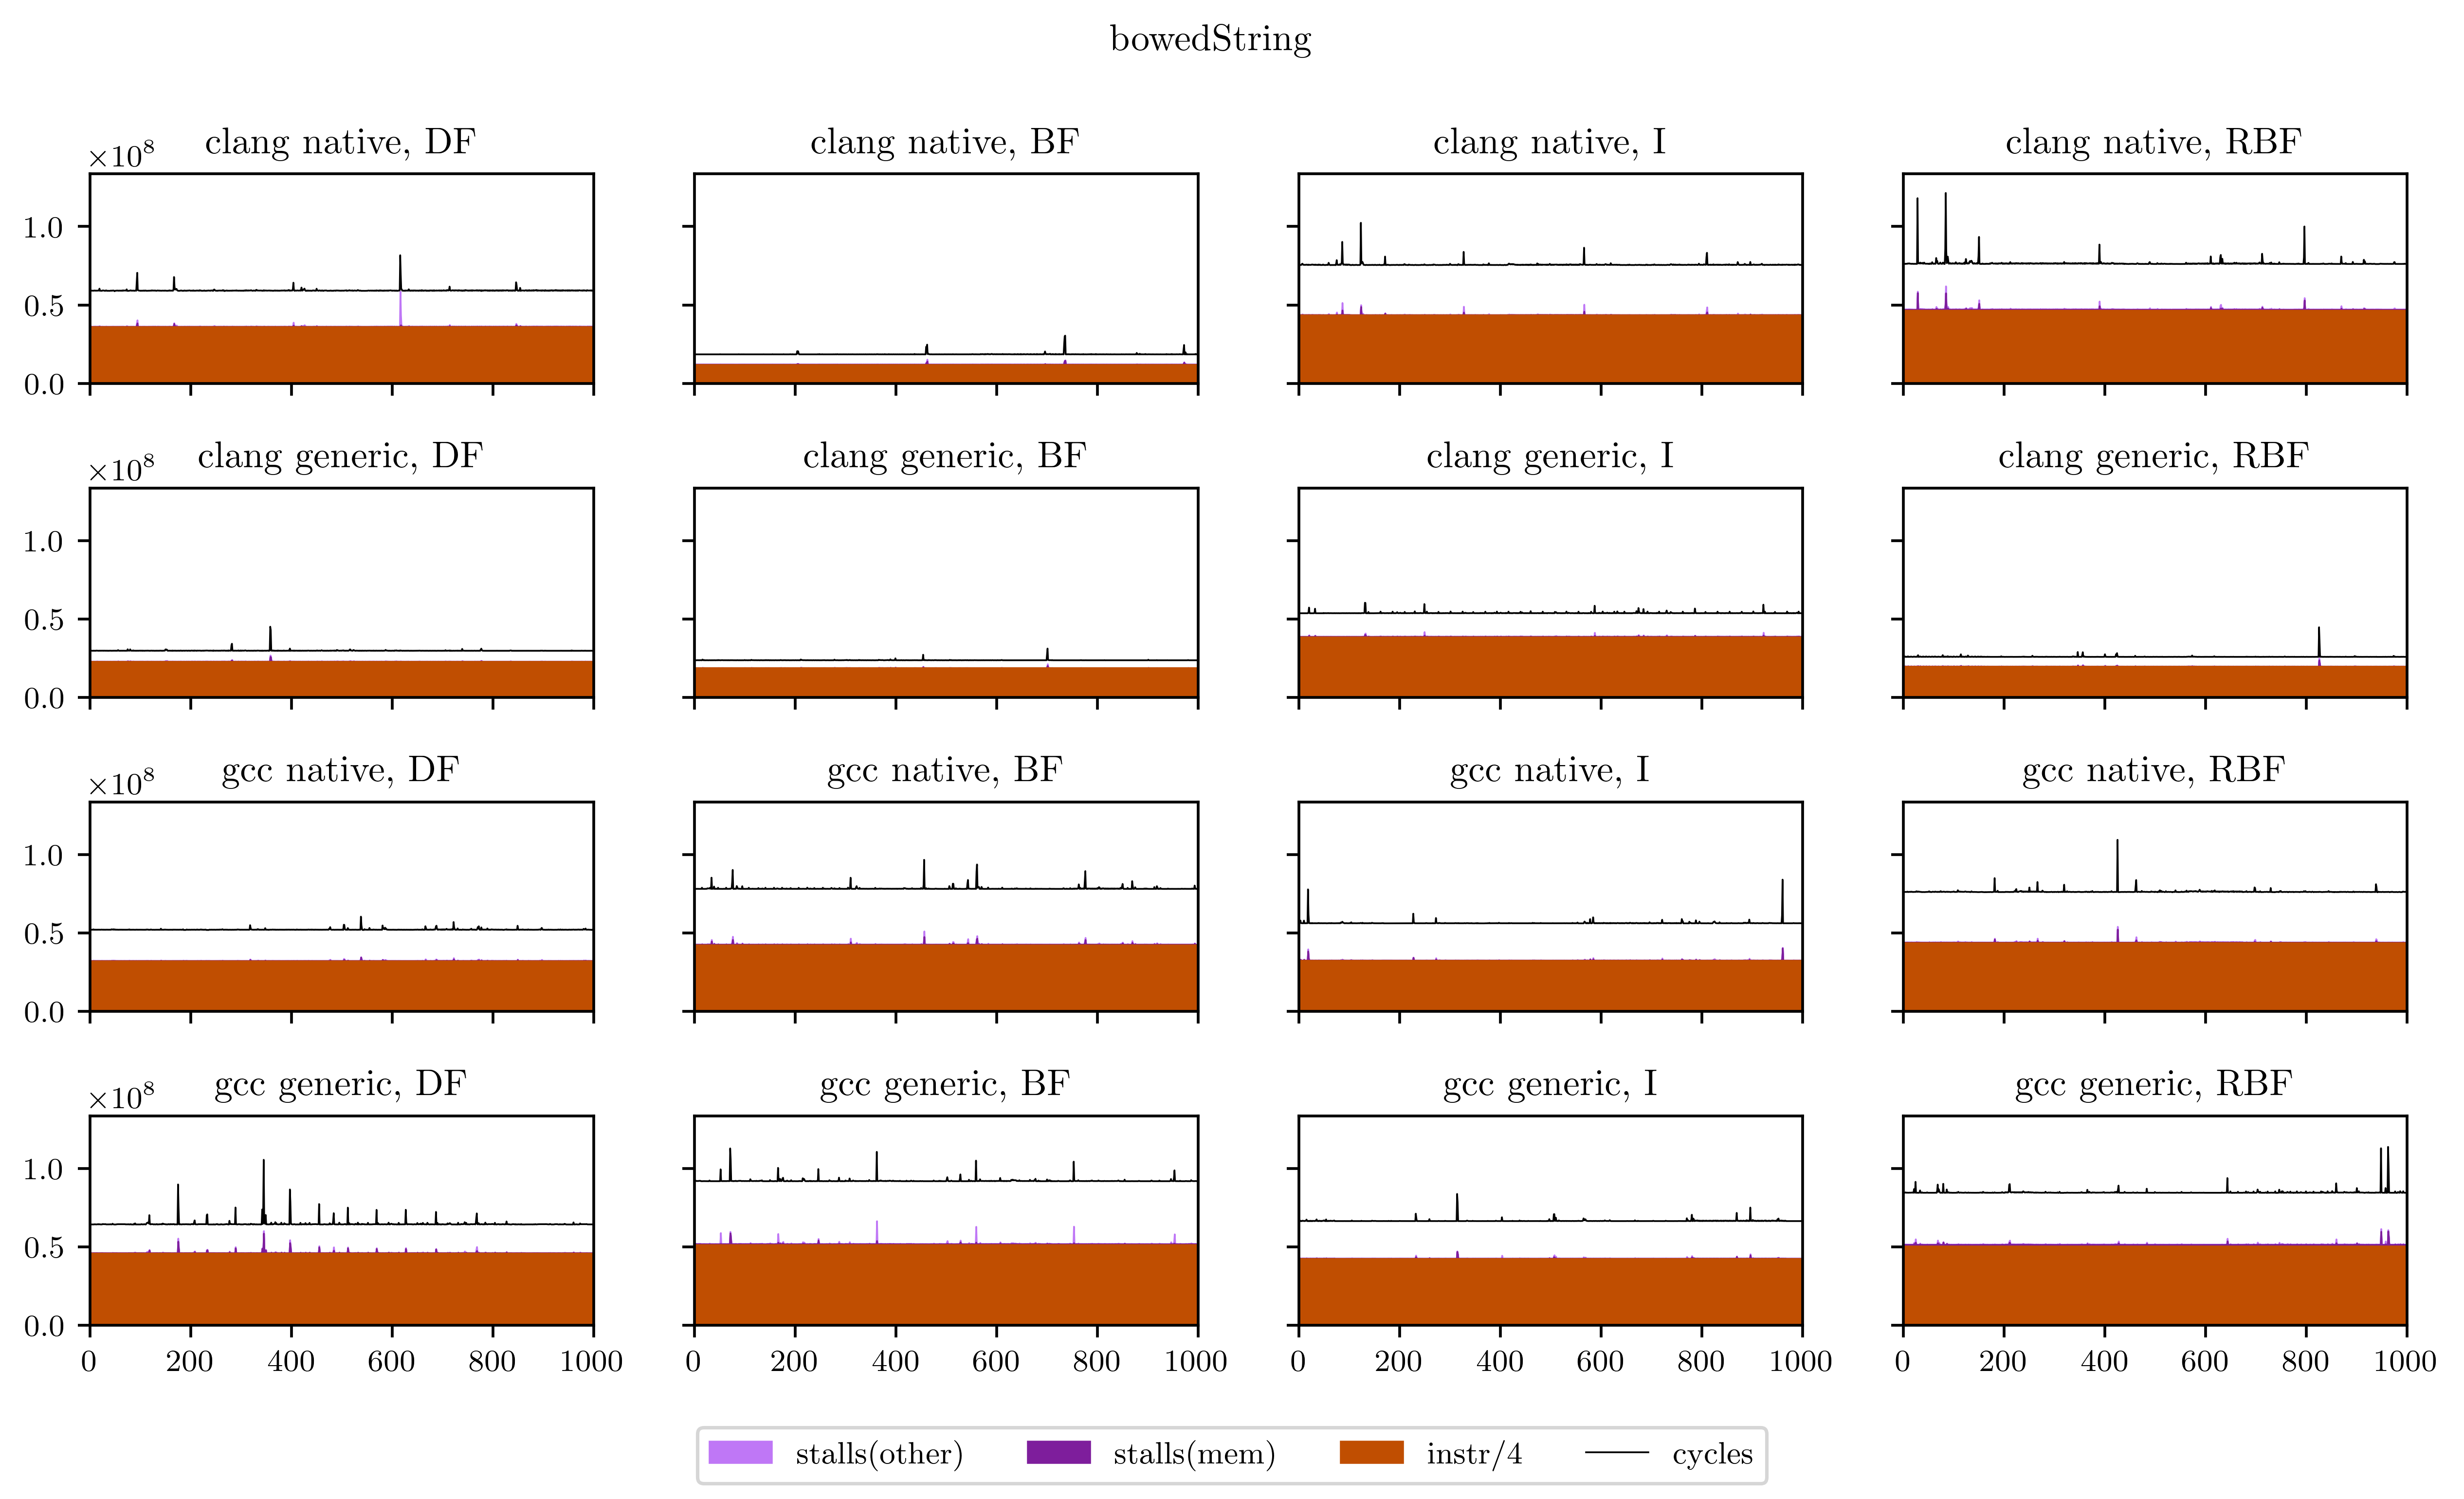
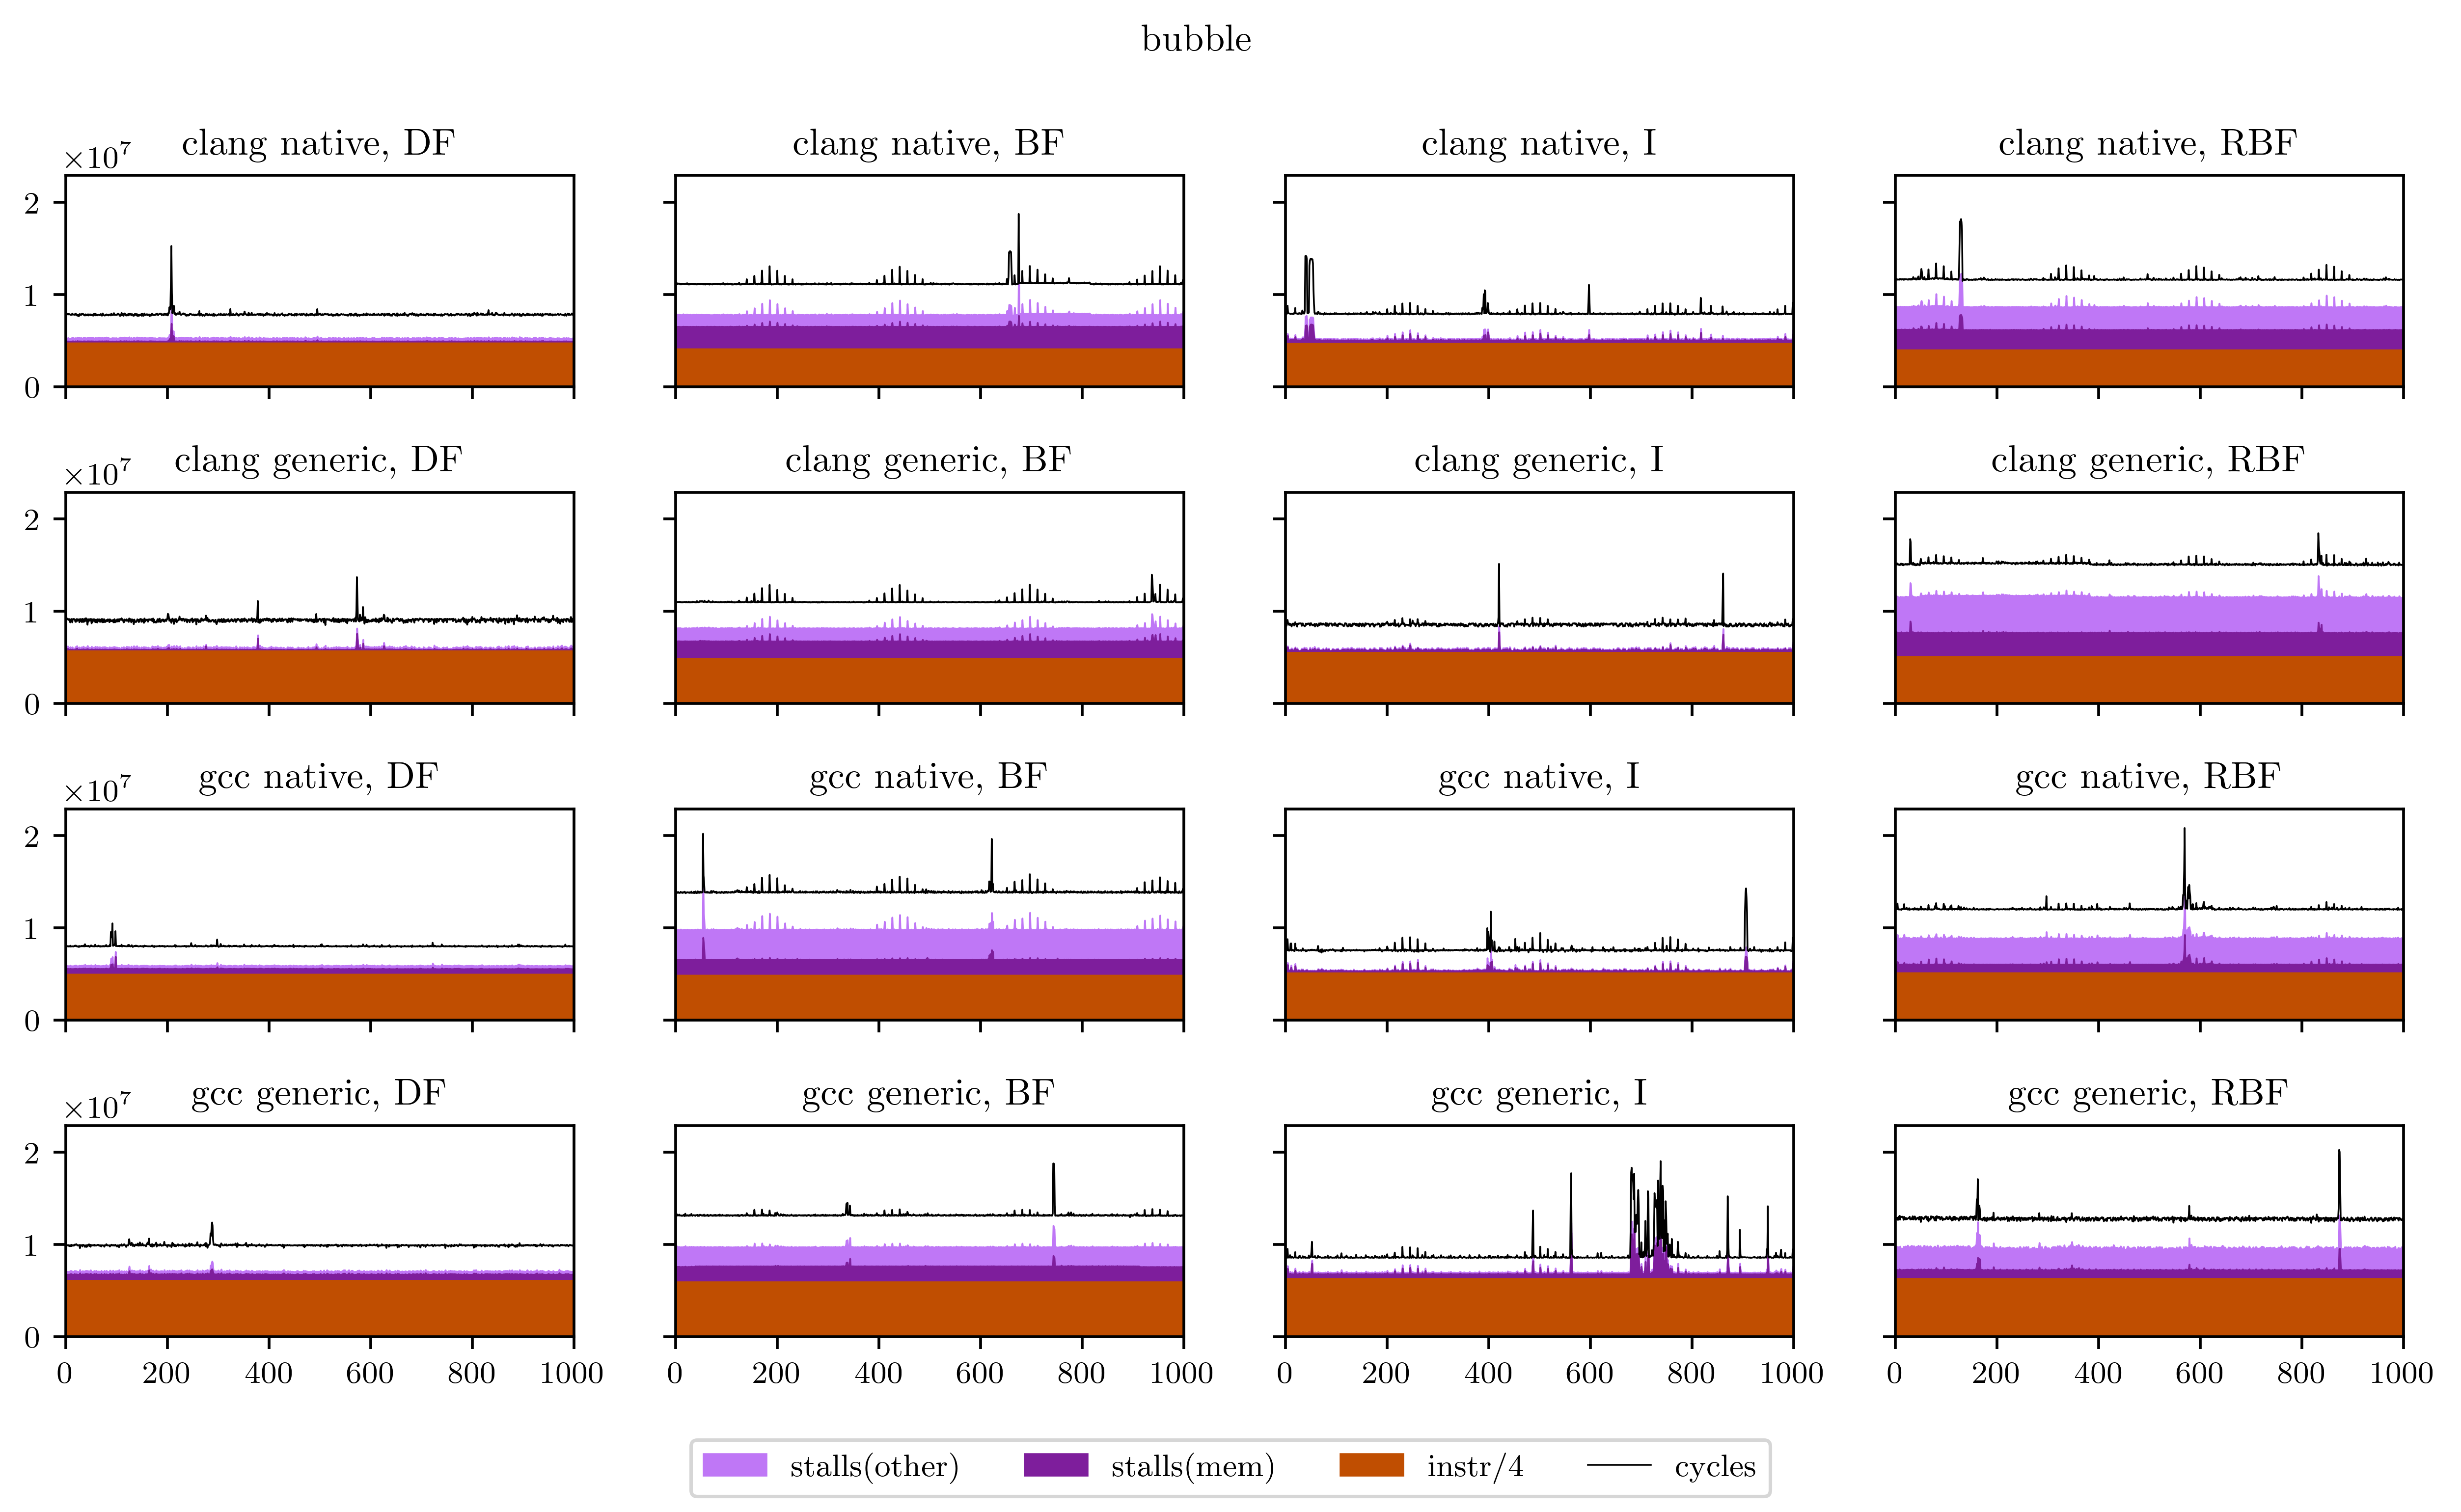
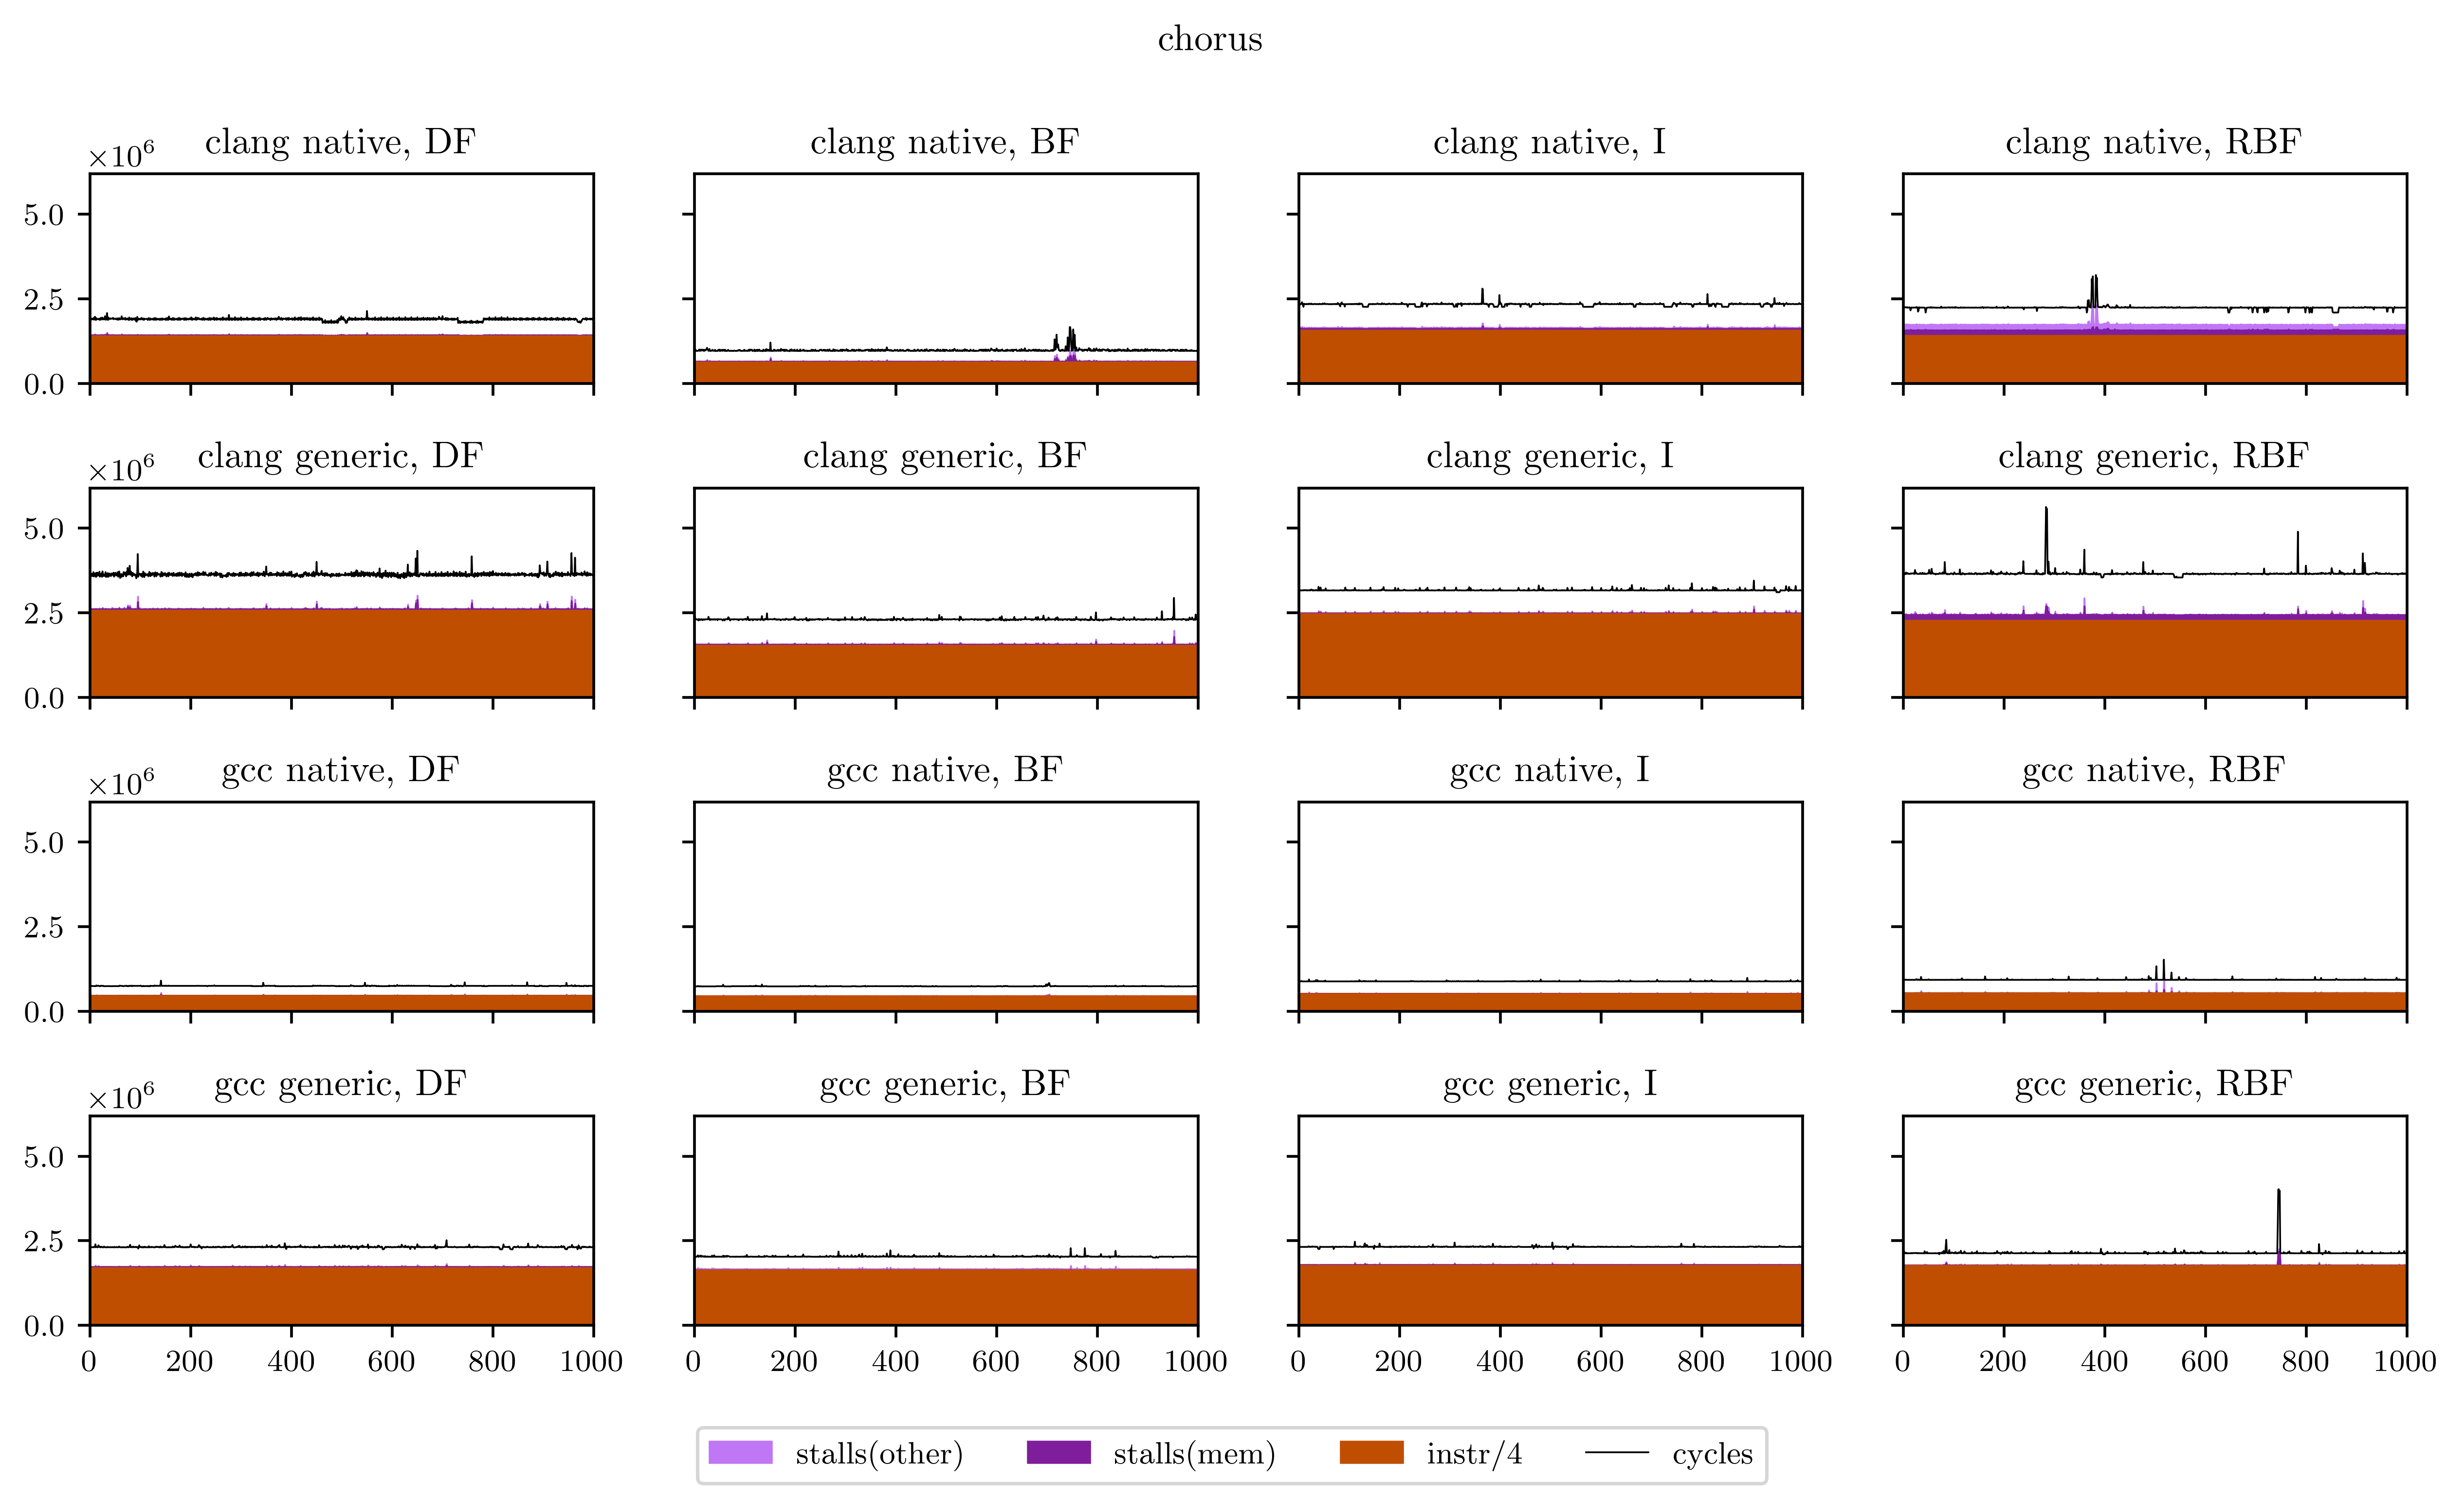
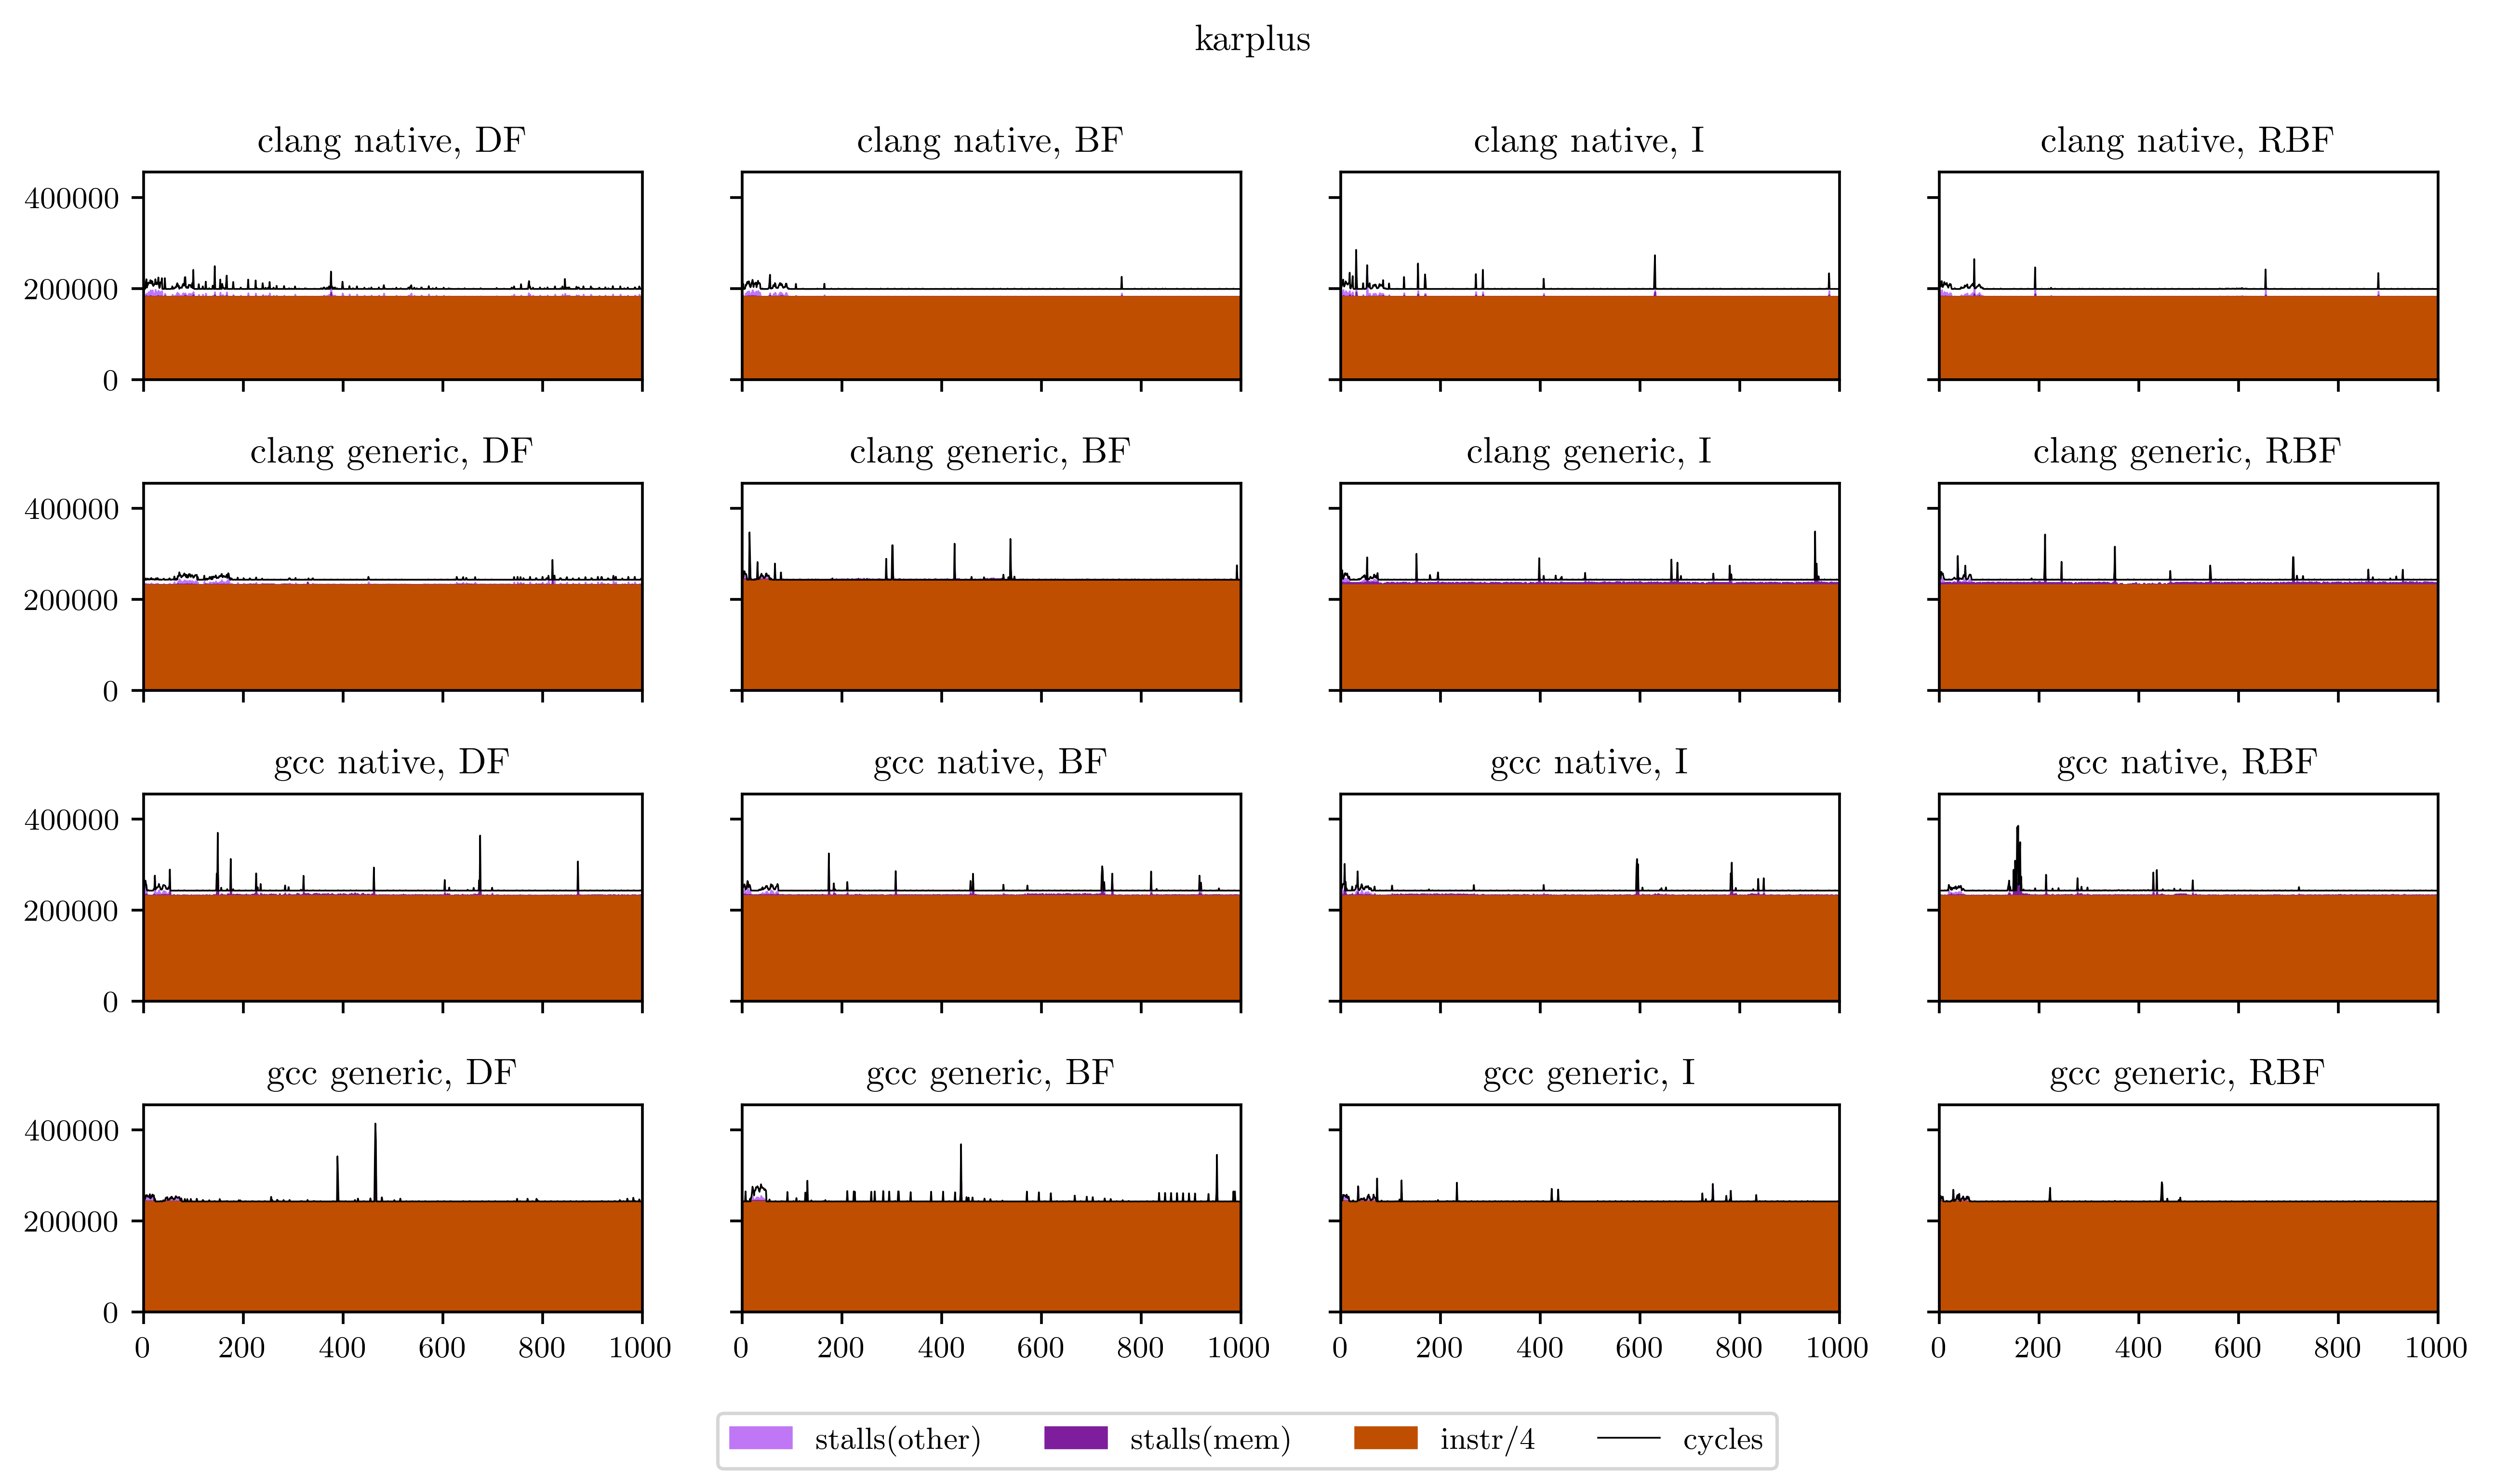
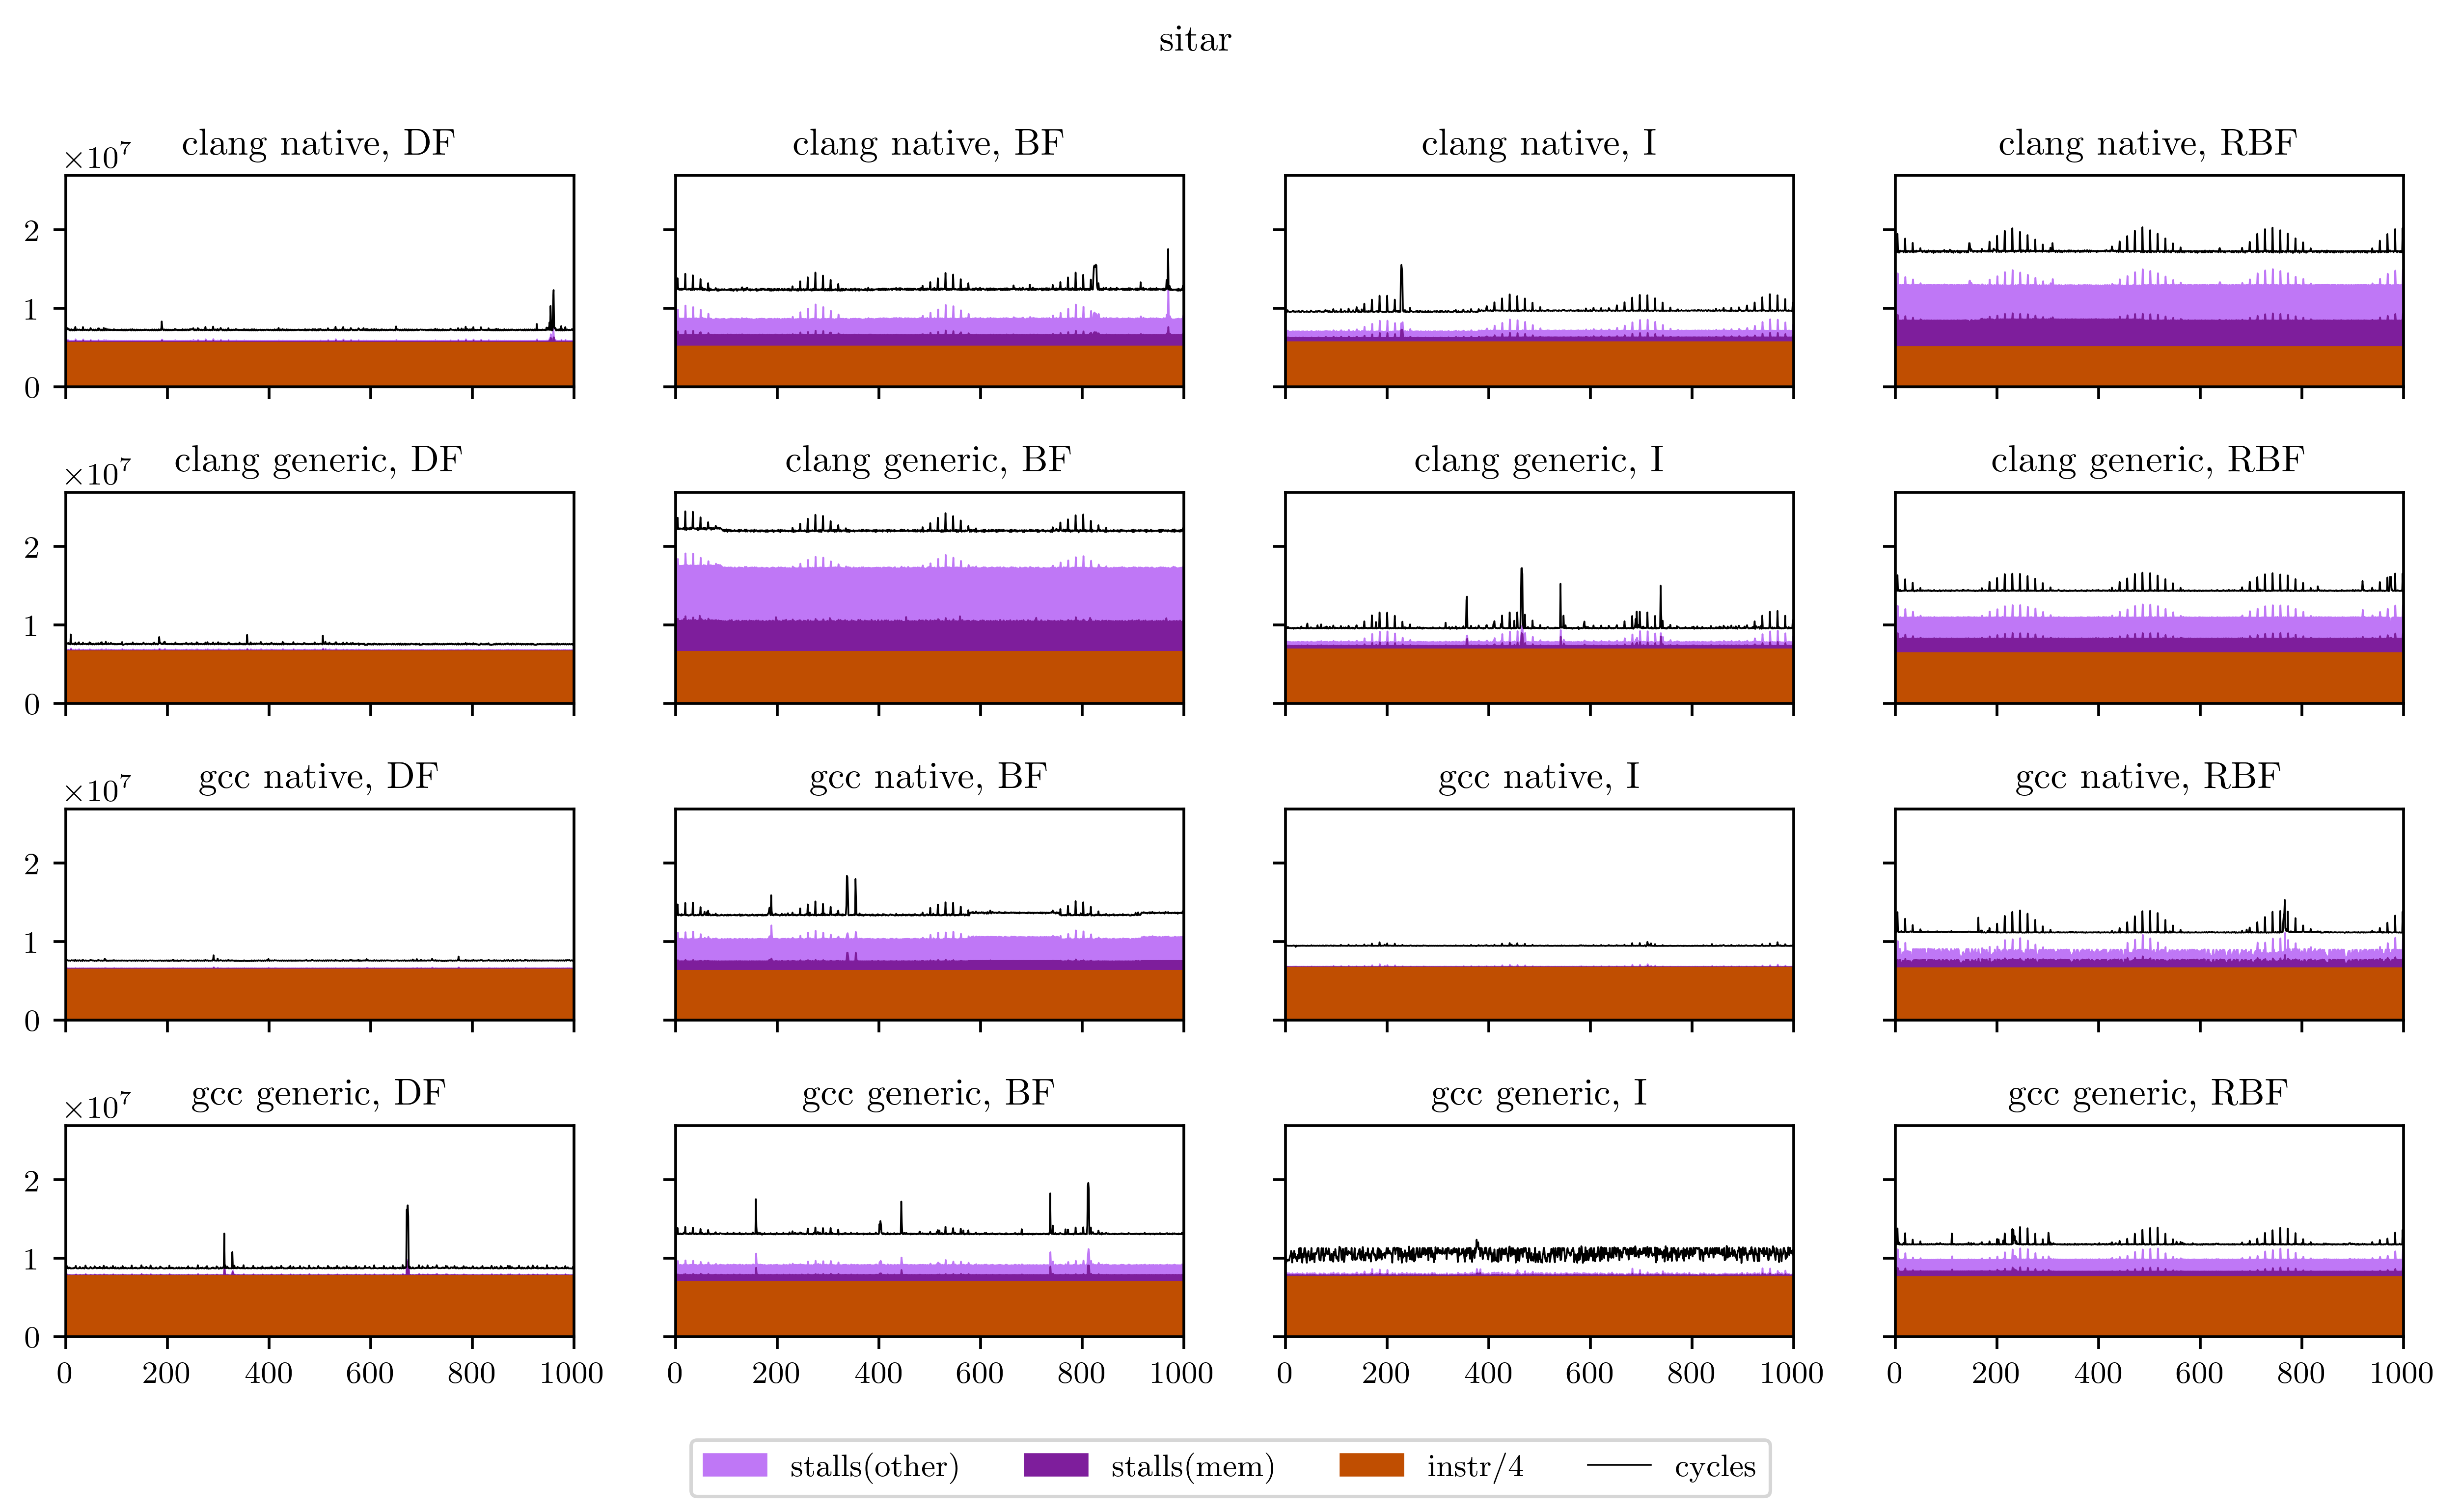
Maybe a little explanation is required here. In every plot, the X axis is every execution of our DSP's main loop (from 1 to 1000), and the Y axis is the number of occurrences of the 4 aforementioned events for this loop. The freeverb is representative of what I found, and what we could suspect from the beginning:
- The breadth-first strategies (BF and RBF on the chart) need a little bit less instructions to execute: the independence of adjacent operations allows better vectorization of the operators;
- On the other hand, the deep-first and interleaved strategies are able to use the result of operations while they're still in the registers, which means less stalled cycles;
- There's a very regular pattern of peaks of memory stalls. I thought first this was measure noise, maybe due to the fact that I was listening to music while the benchmarks were running. So I ran them again and obtained exactly the same peaks, at exactly the same places. Then I understood that those peaks are due to the use of delay lines: in Faust, delay lines are implemented using circular buffers. On most iterations, we access to only one contiguous zone of a circular buffer. But on some, when the end of a buffer is reached, we need to load the beginning and trigger a second memory load, which means more stalled cycles. The regularity is a result of the aliasing between the loop size (44100) and the circular buffer size, which can vary but is always a power of two.
With this freeverb program we have a case where breadth-first strategies lose, but when no cache problems occur, they sometimes win, like with this drums physical model:
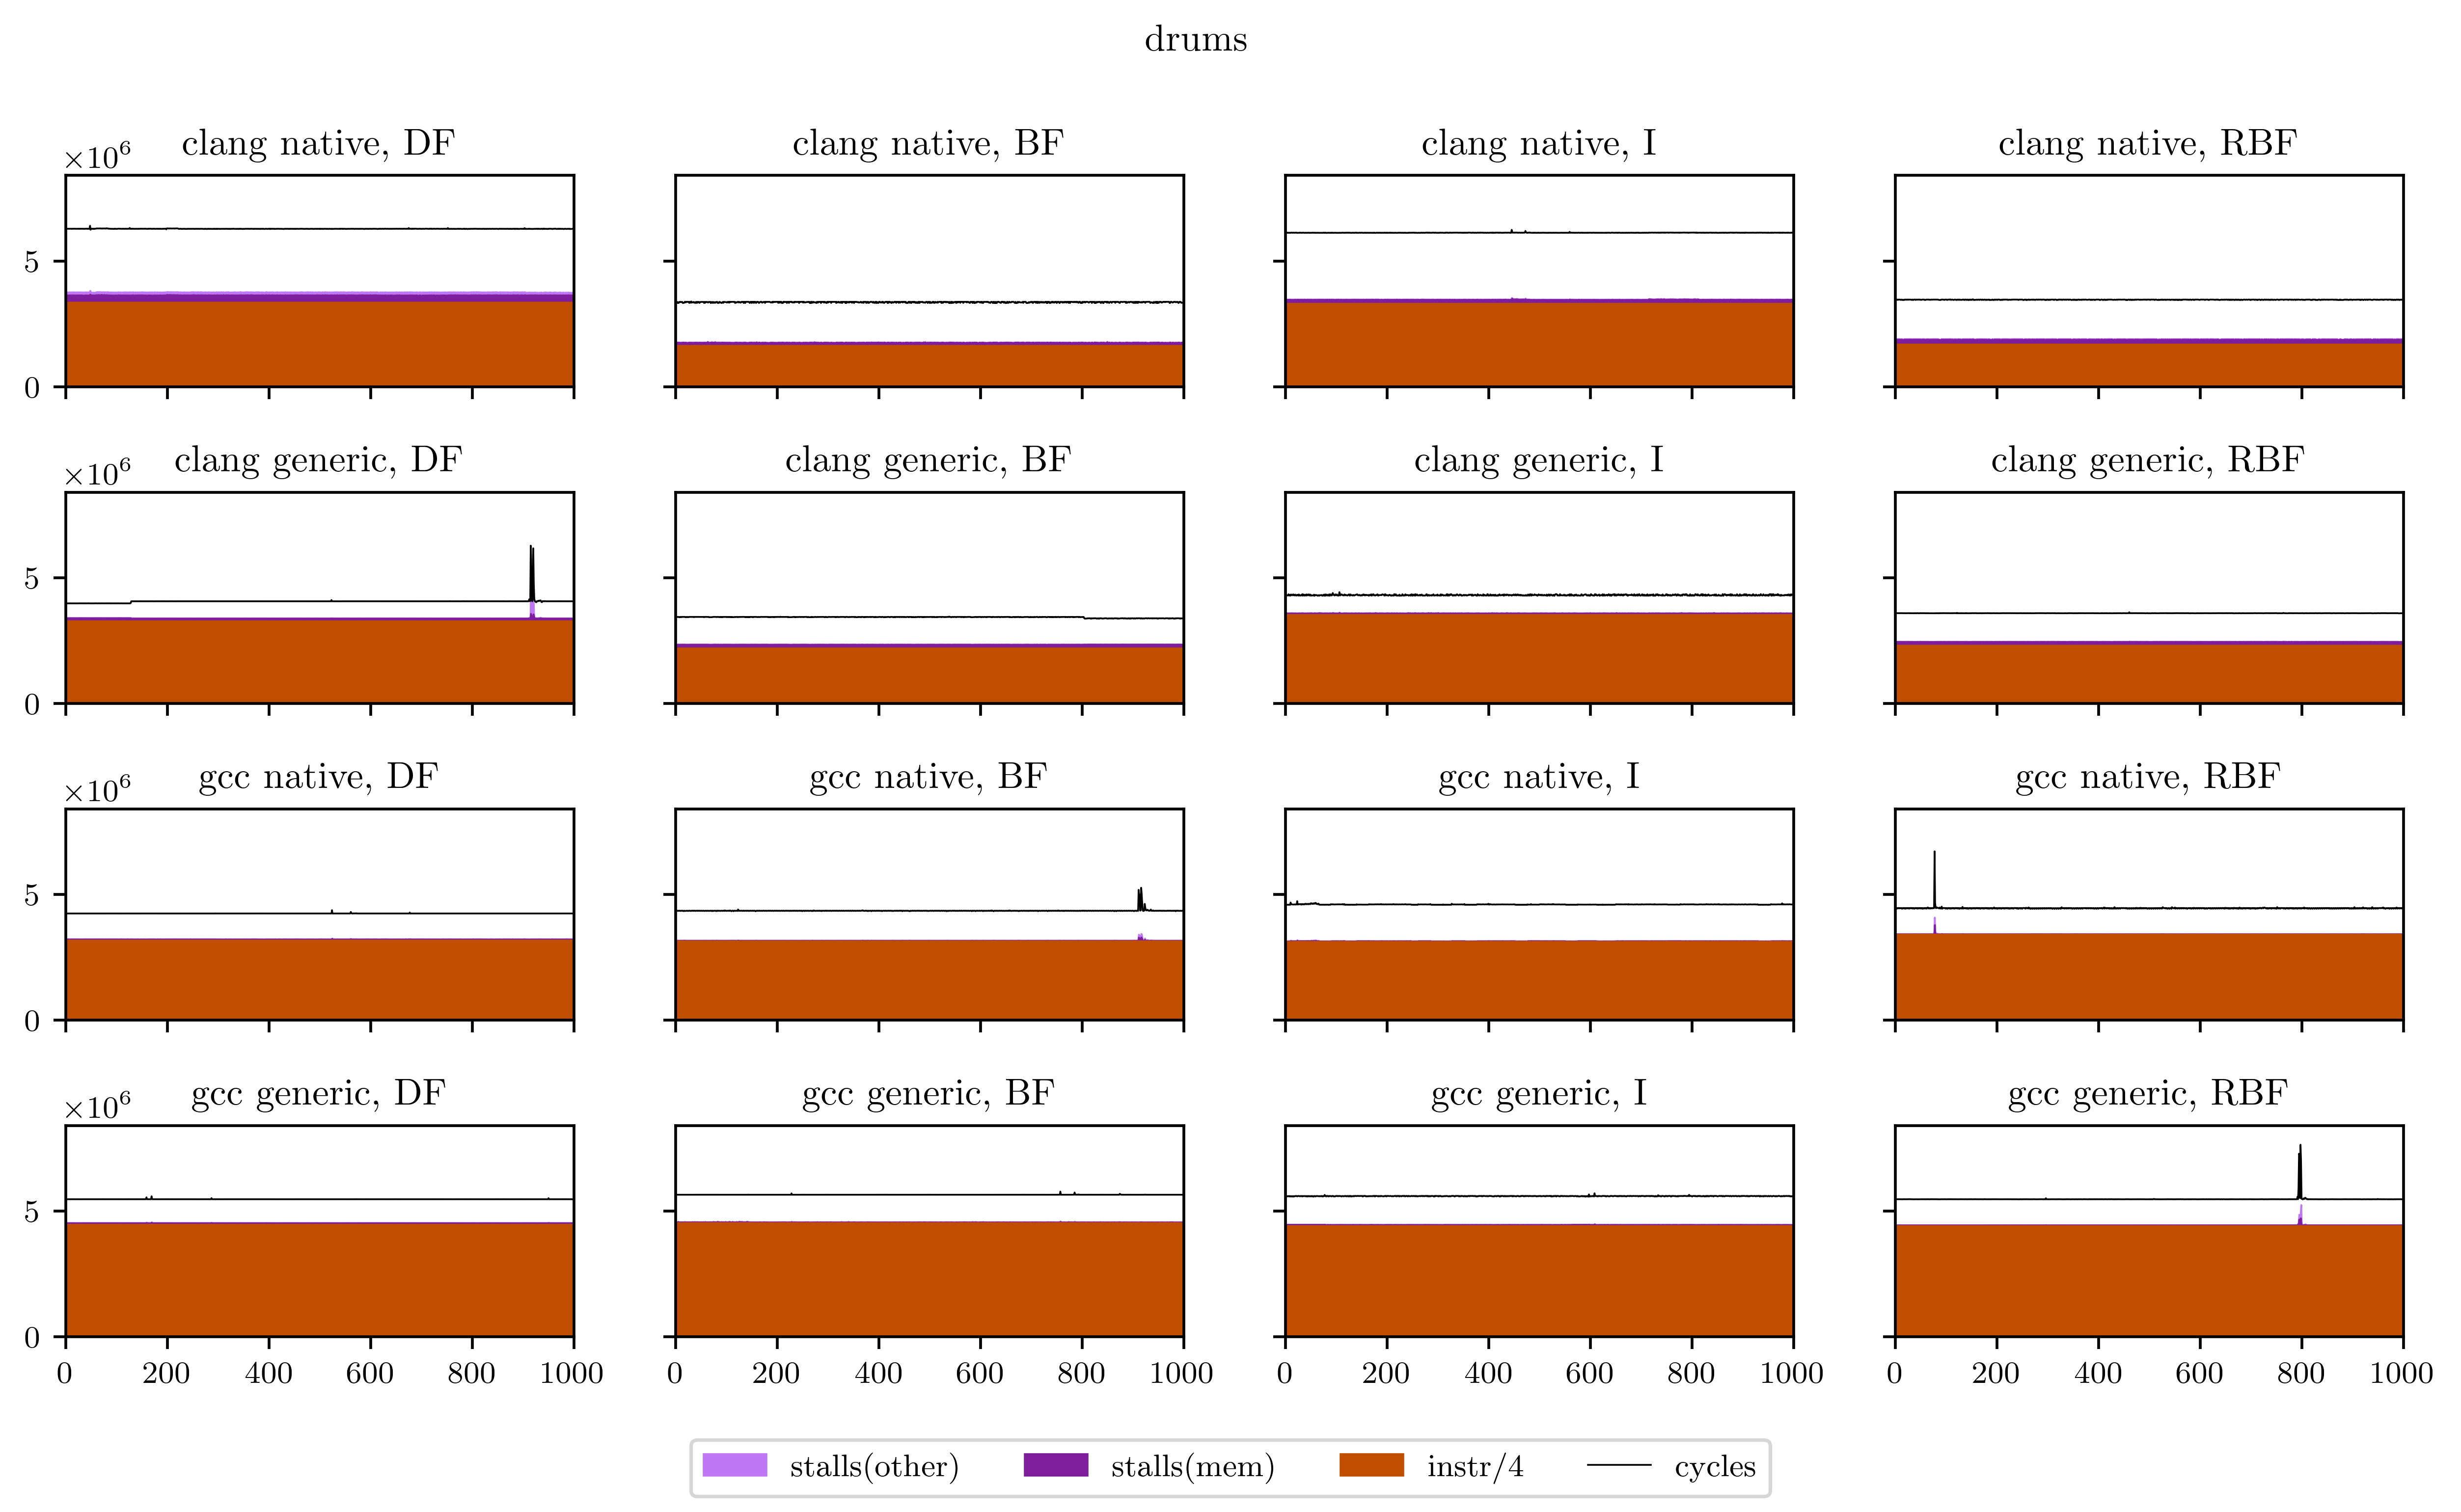
Although we can see here that the differences only arise with the Clang compiler, maybe because the auto-vectorization worked better?
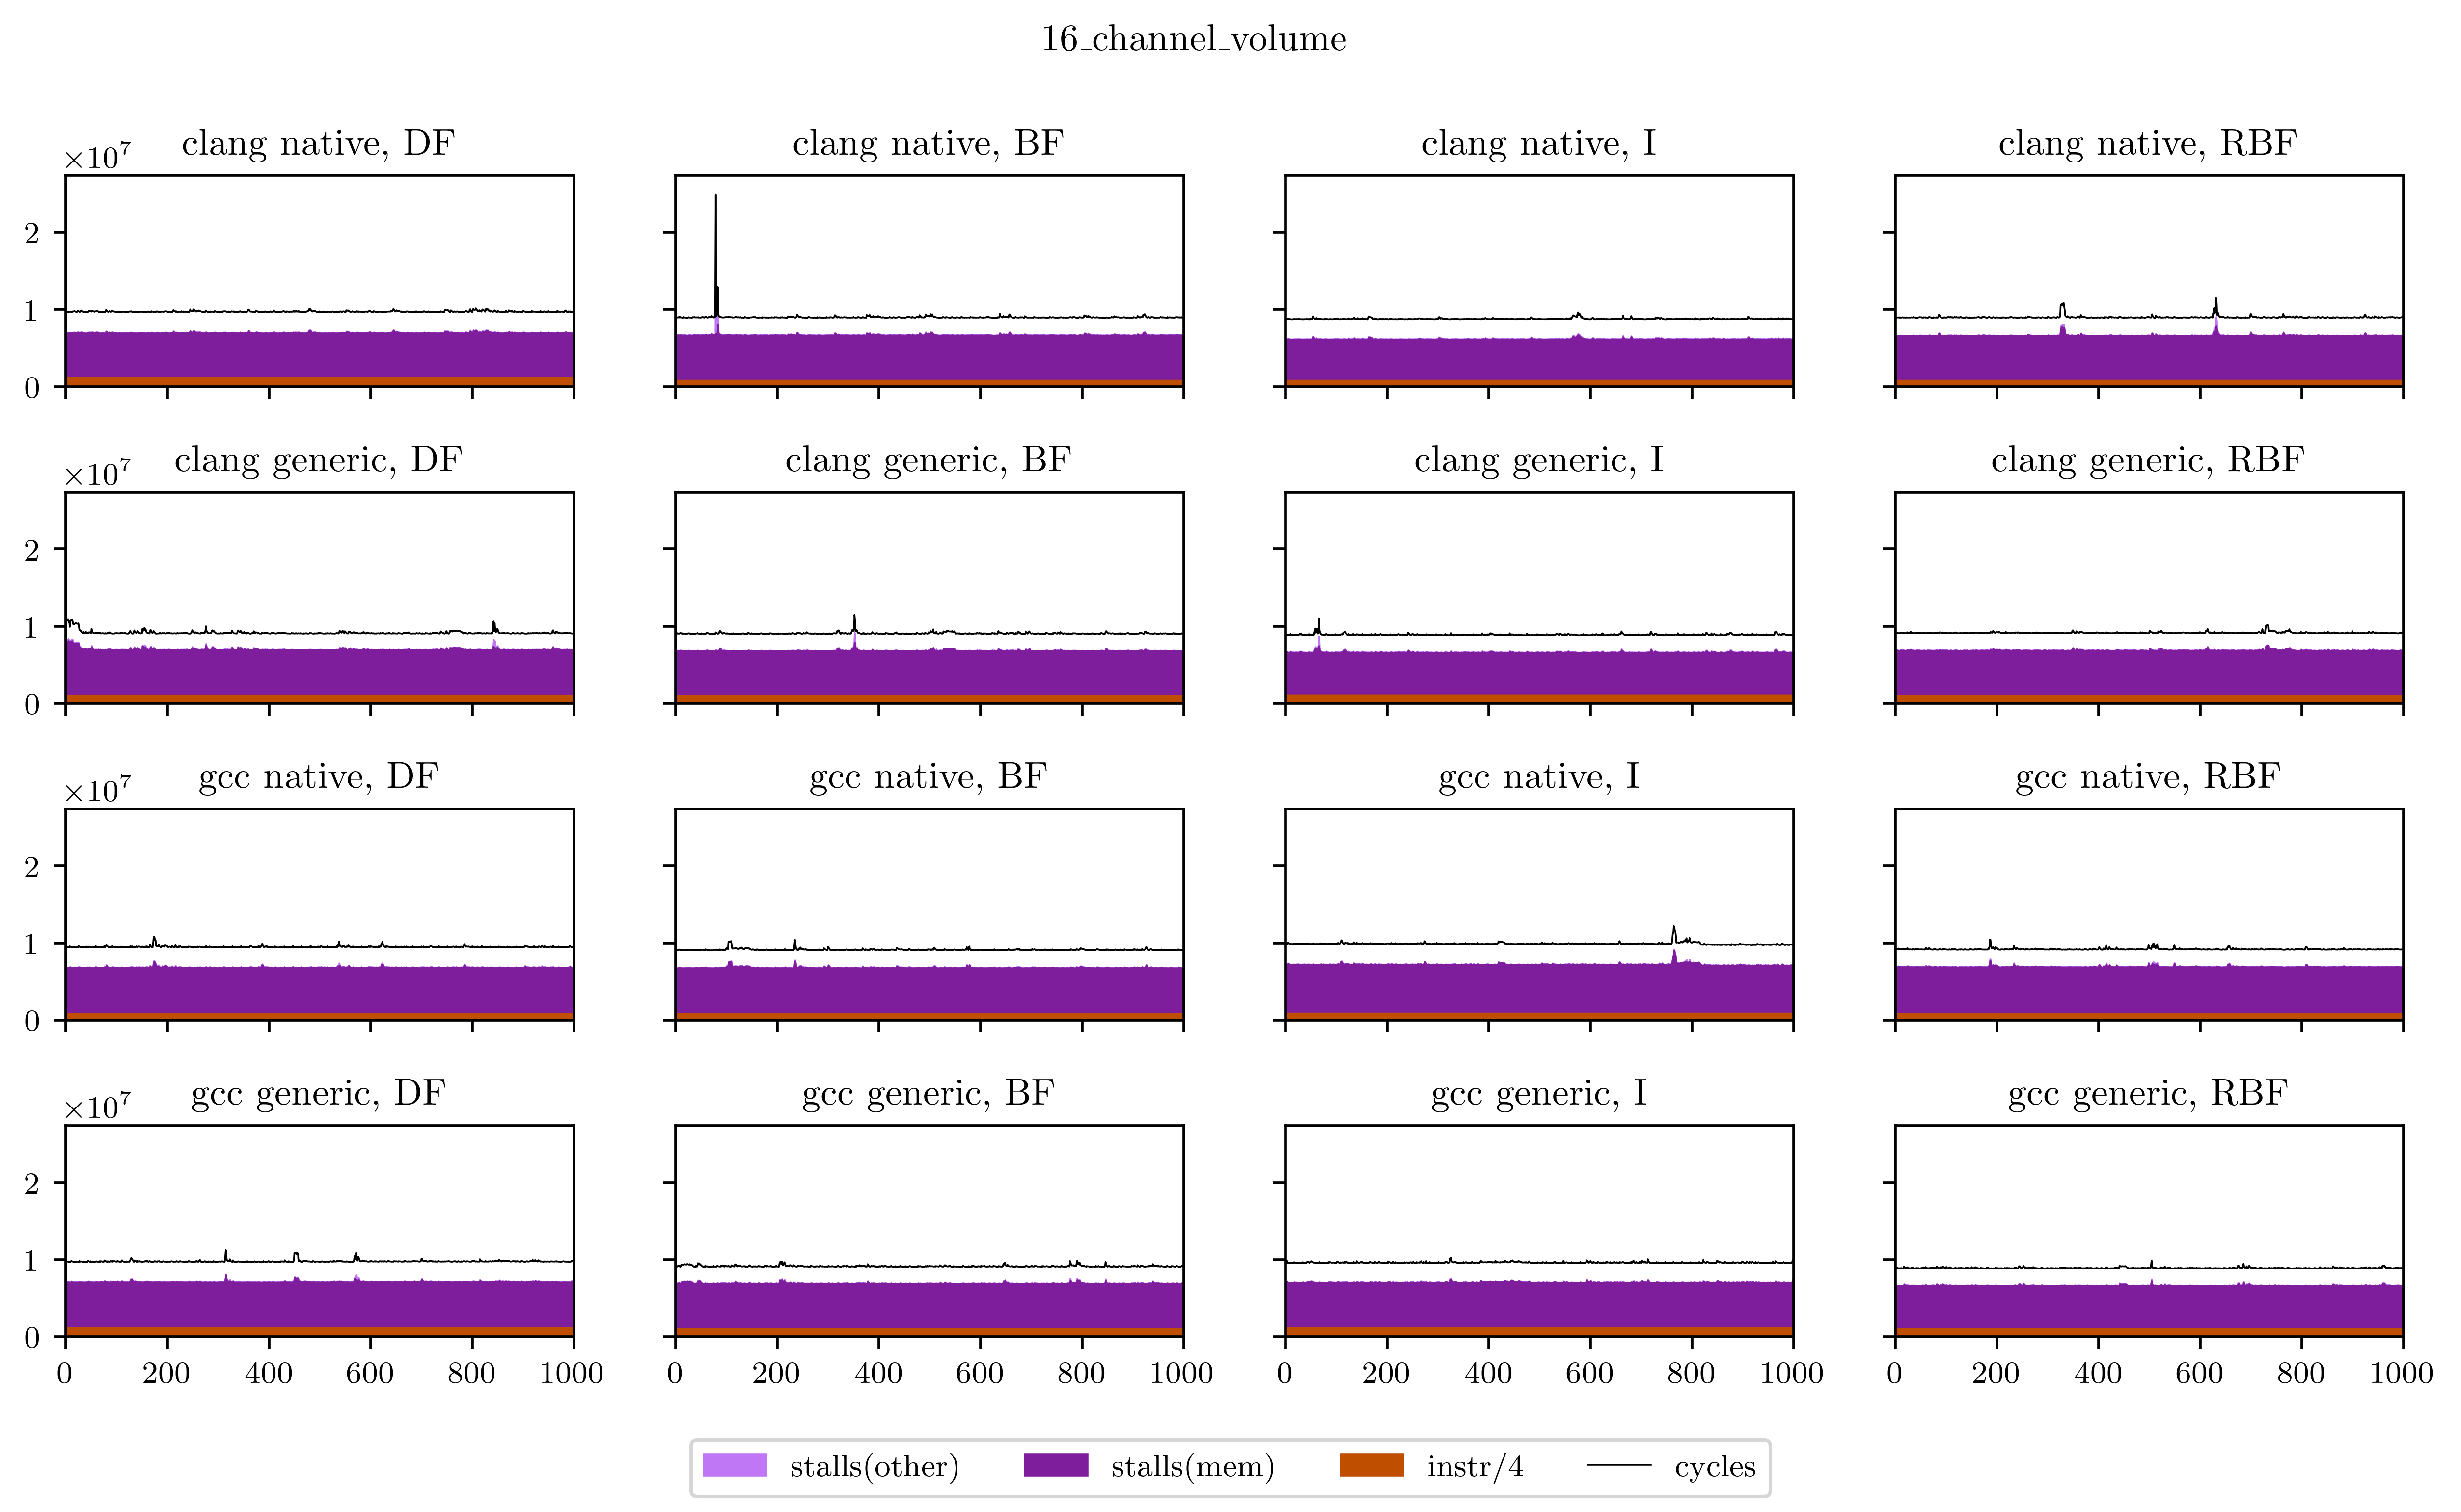
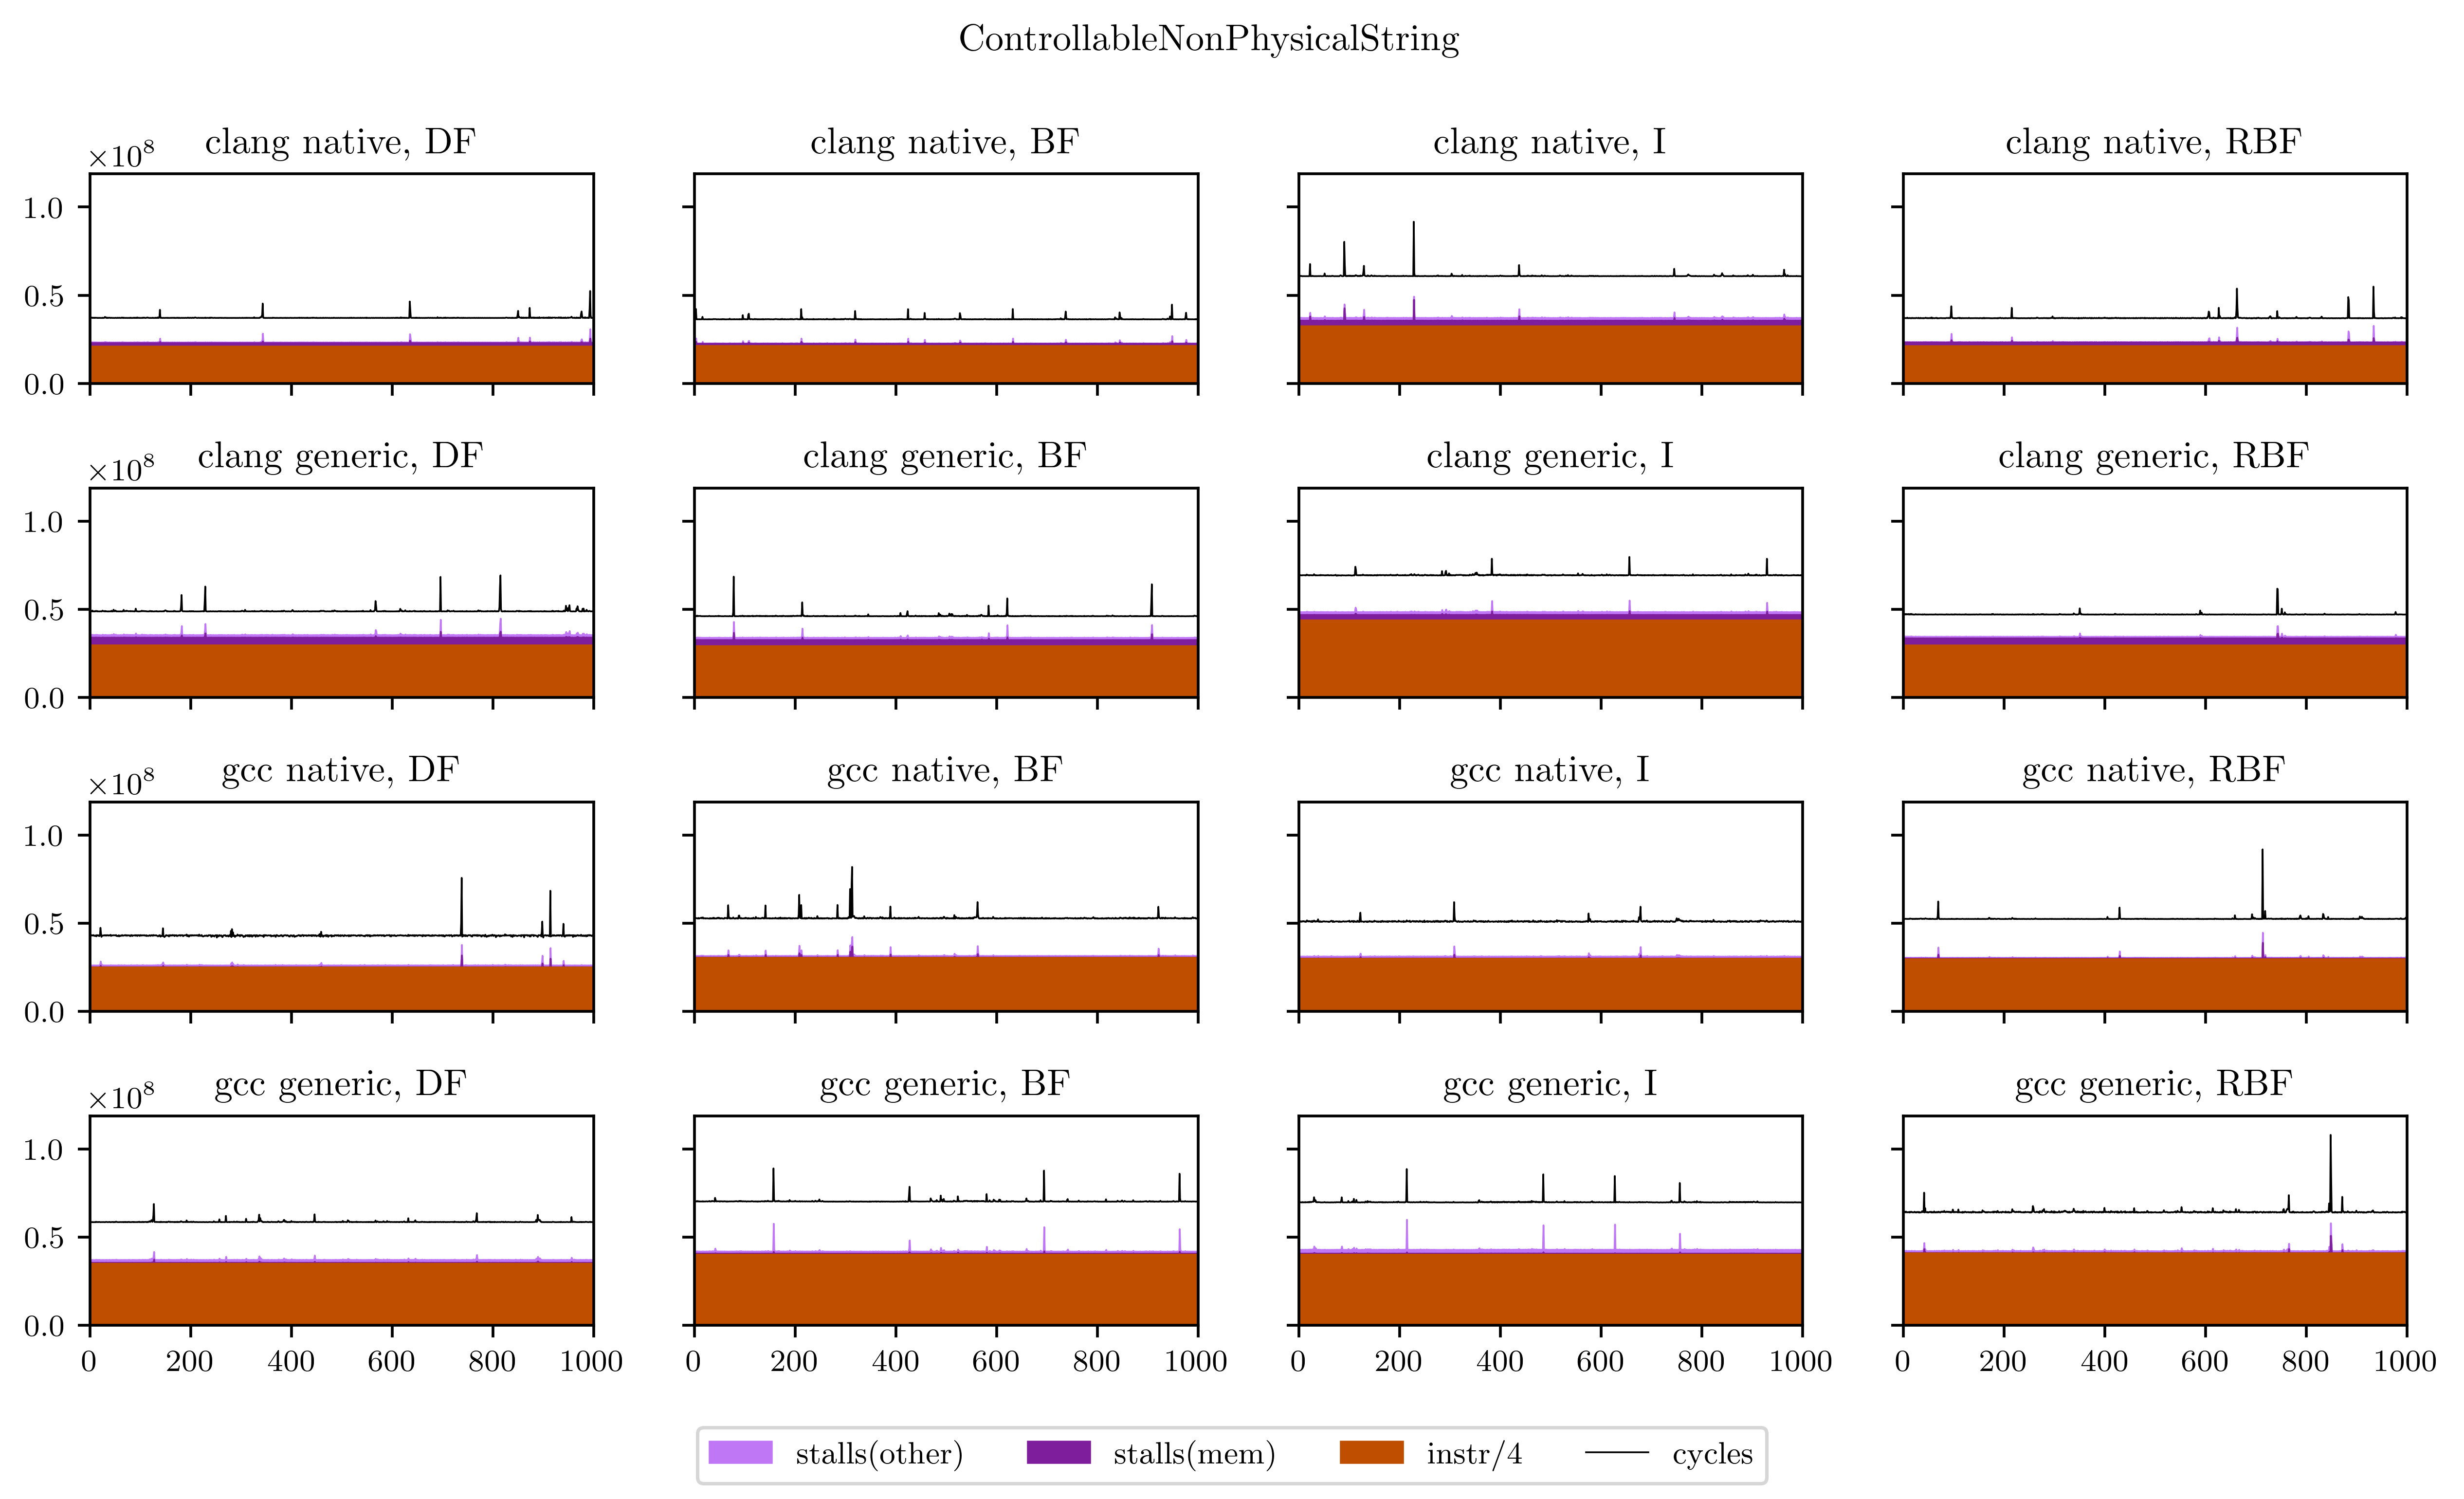
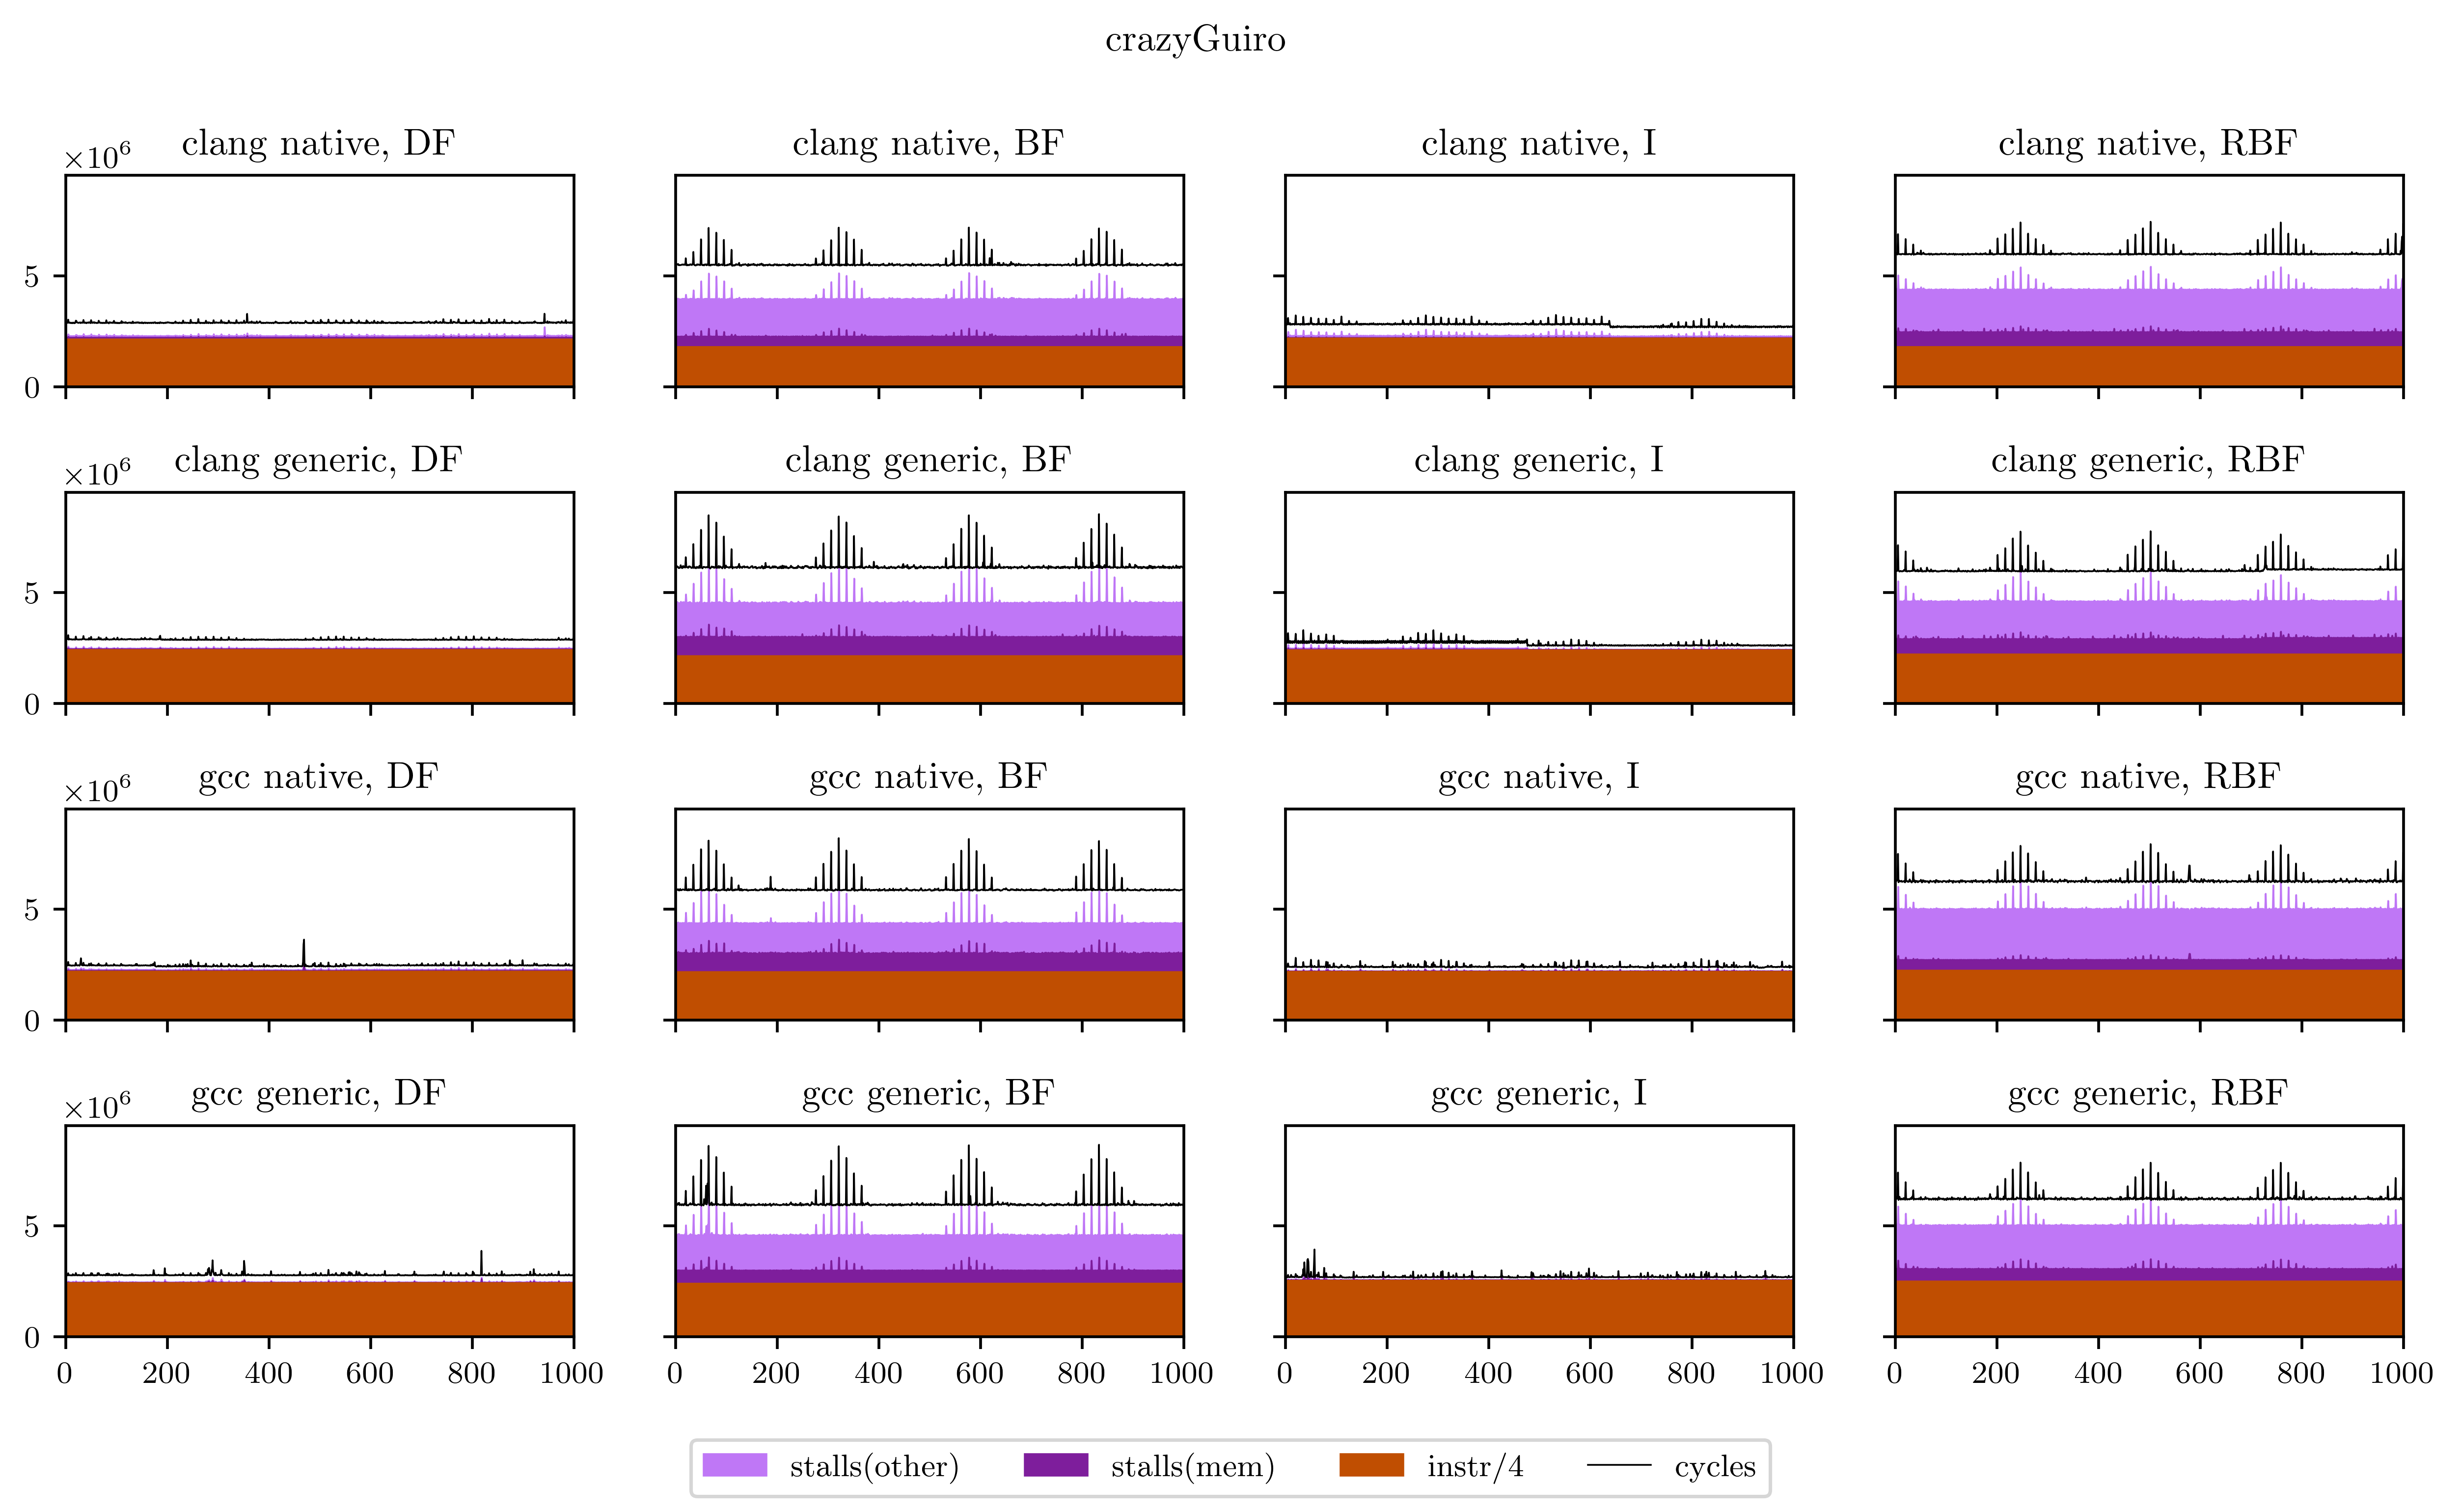
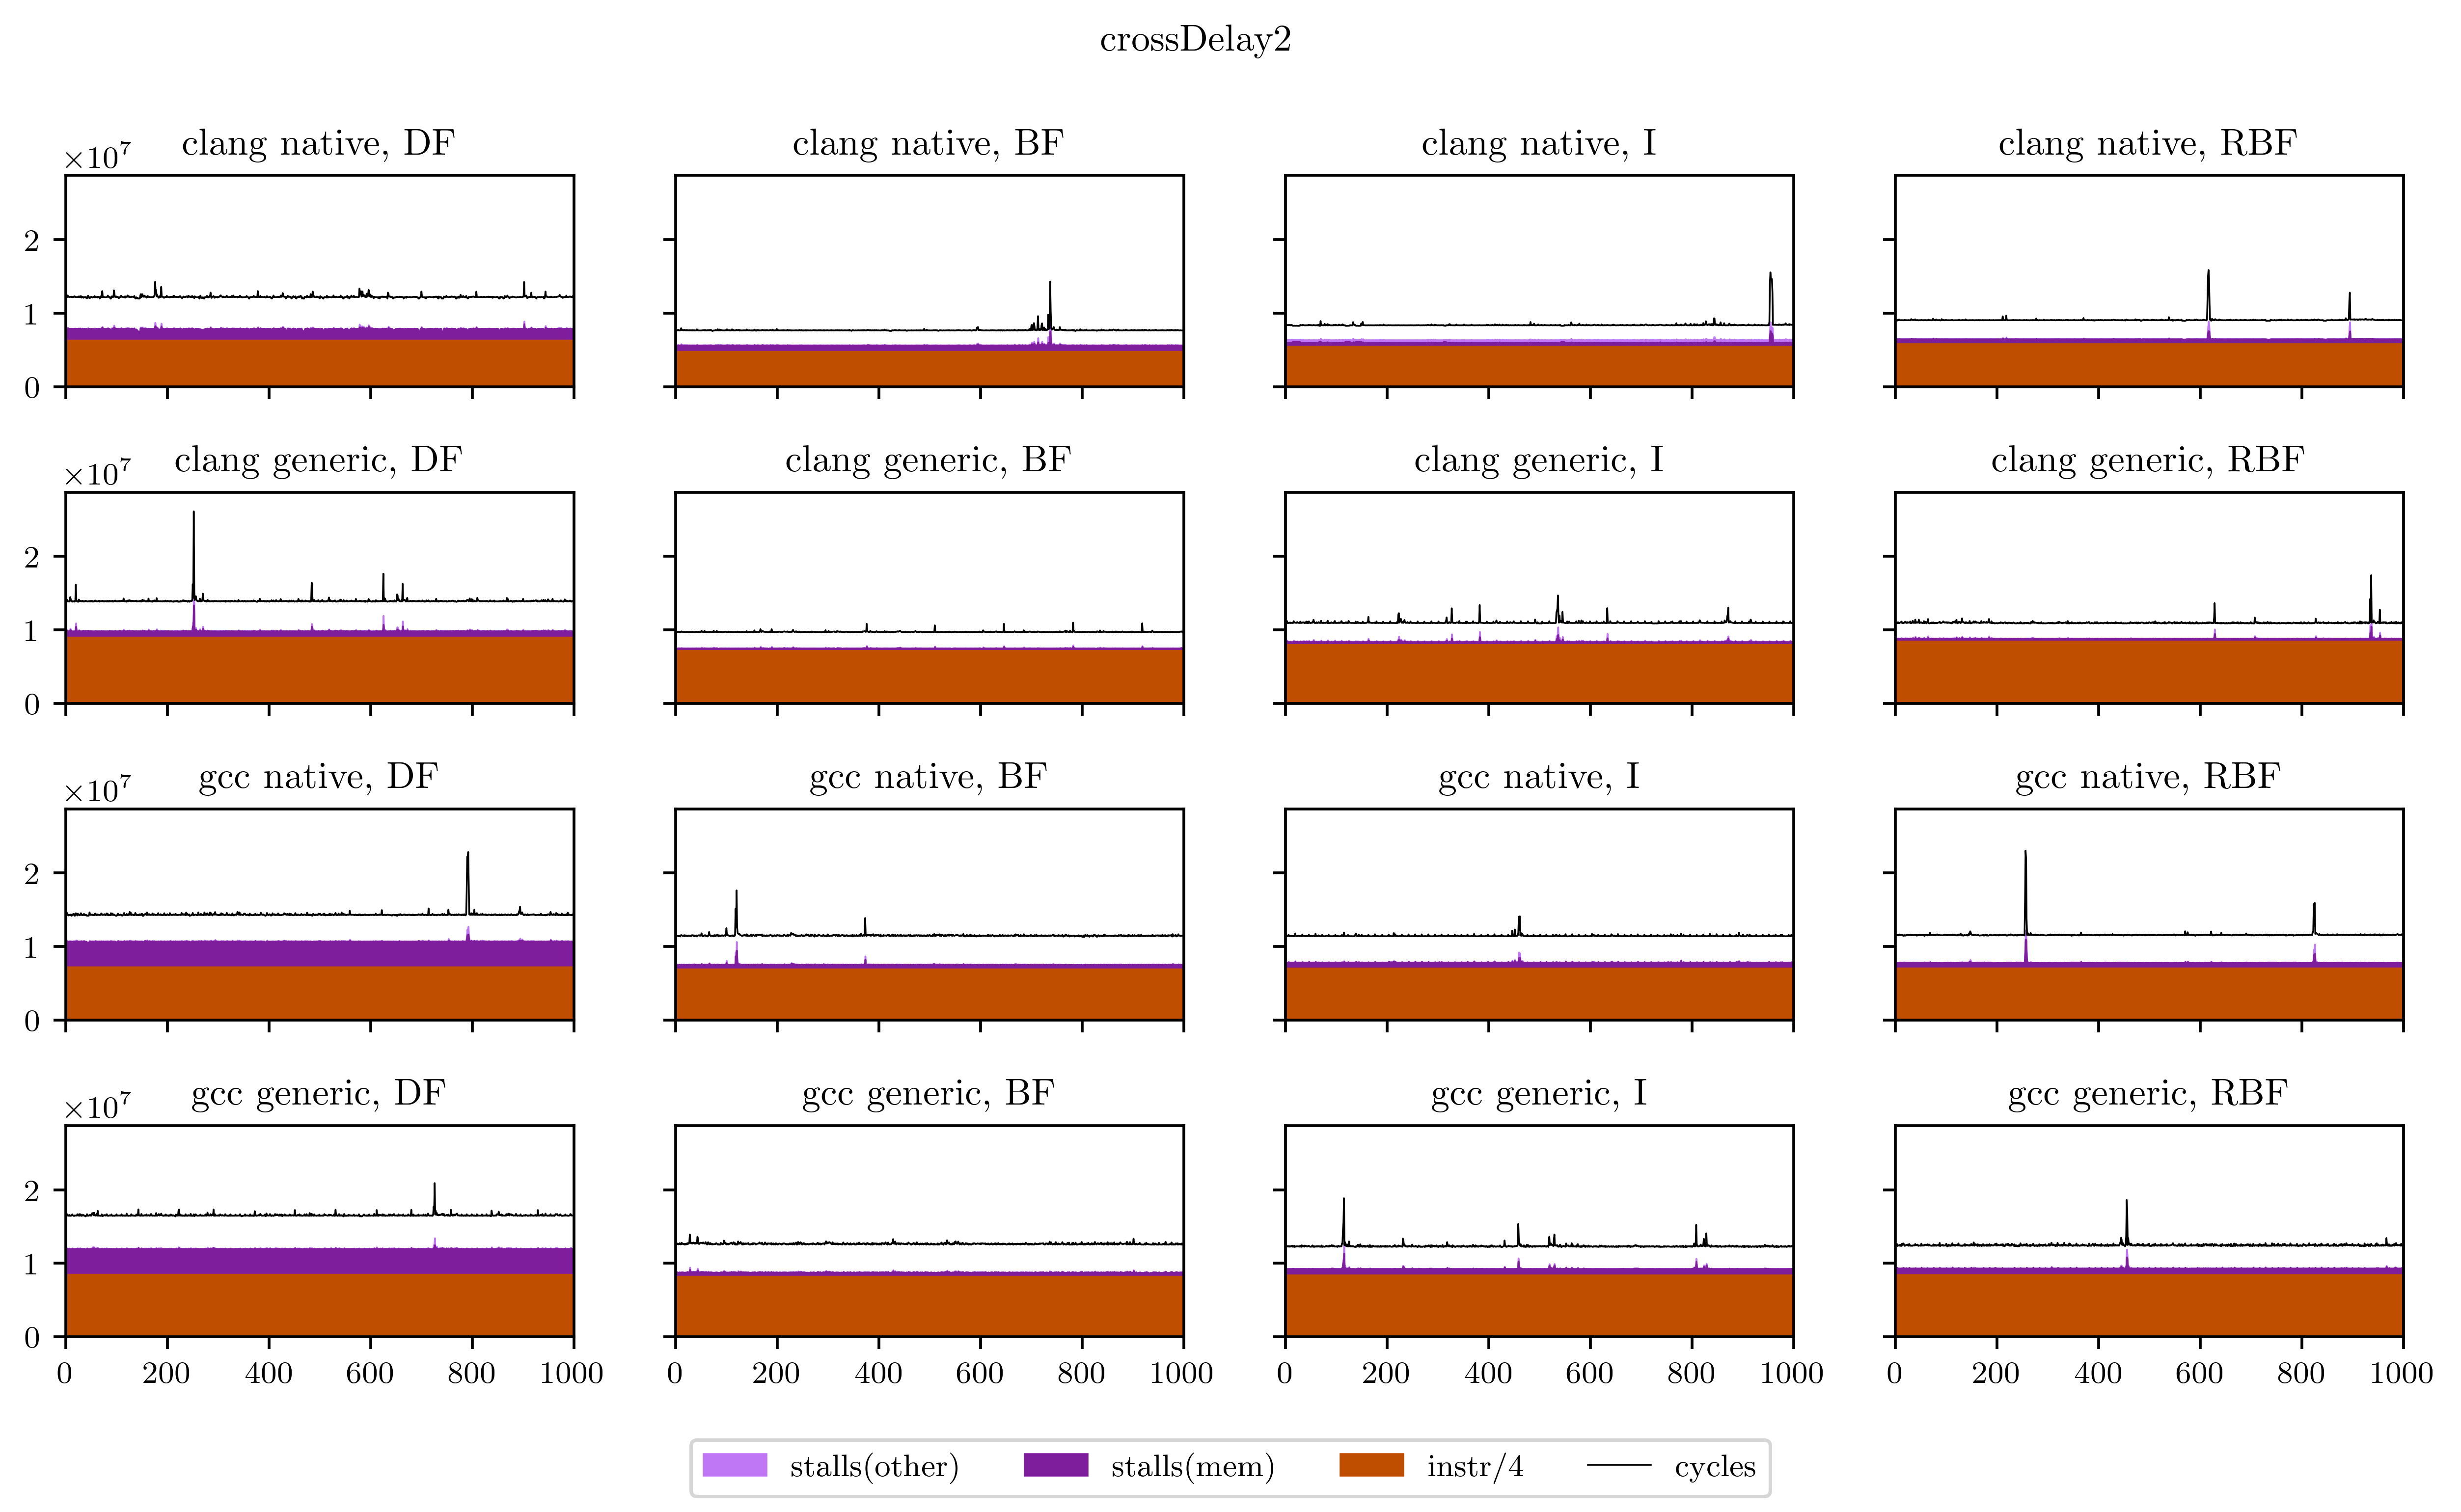
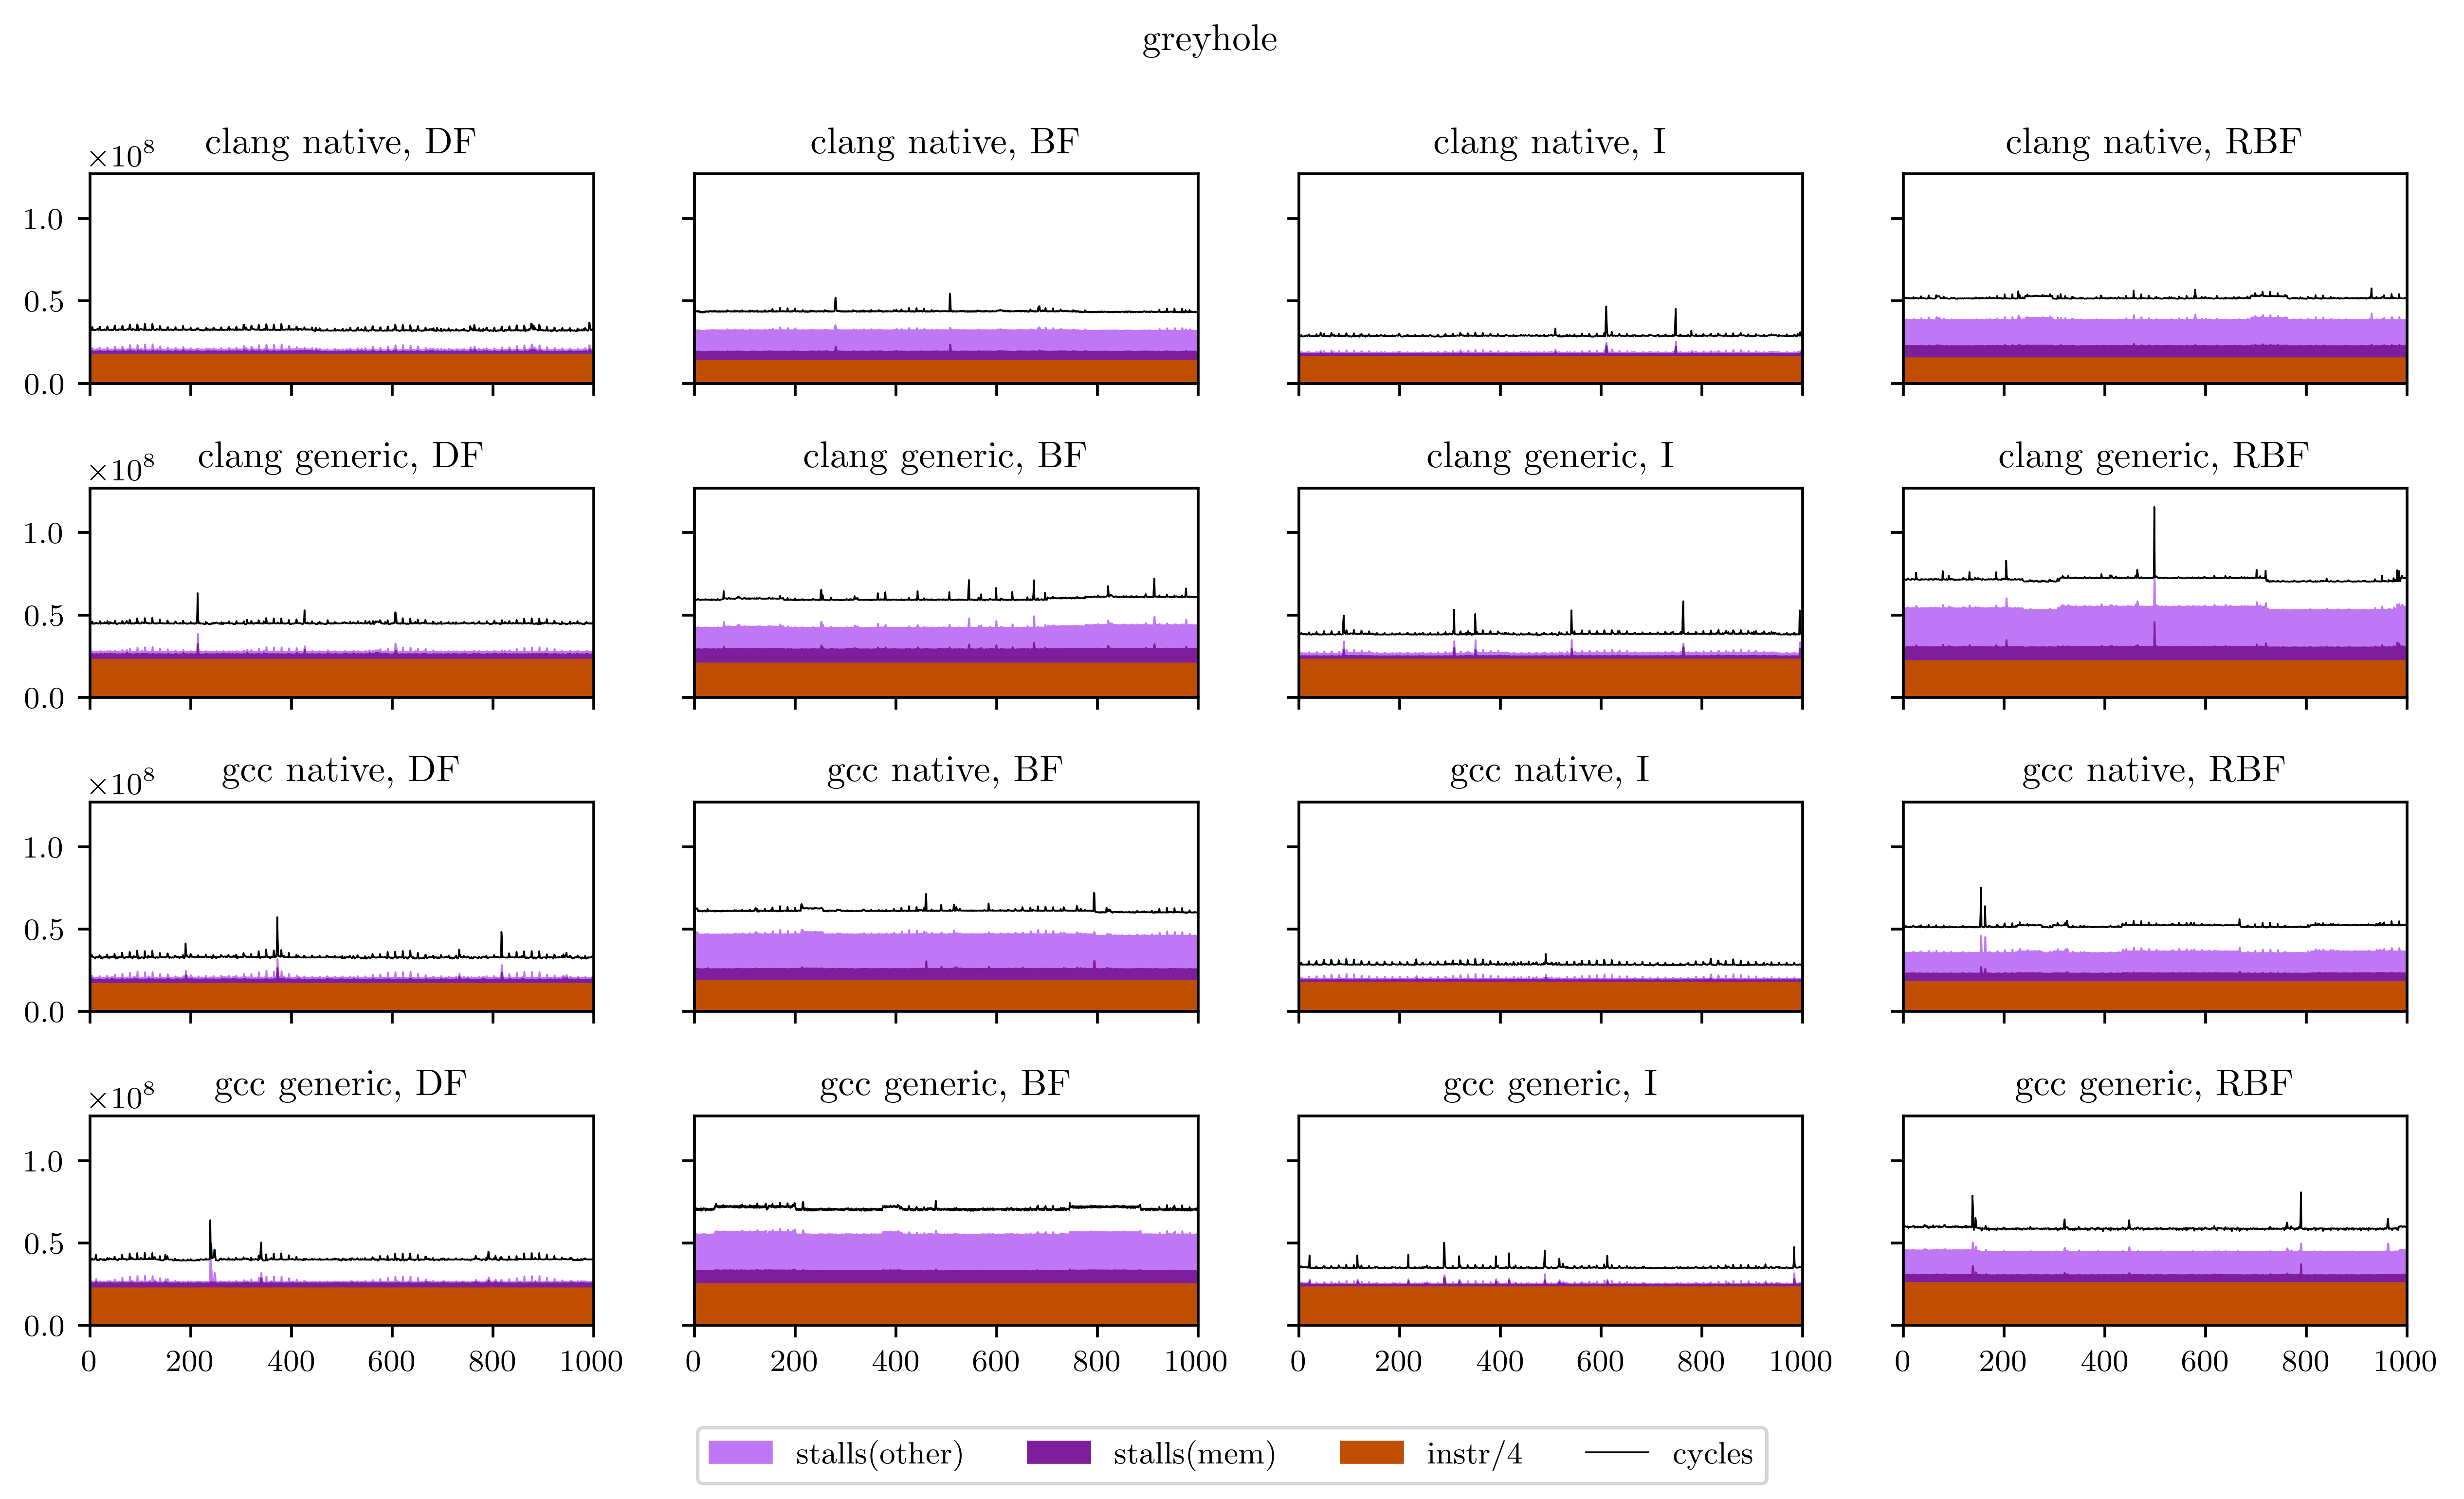
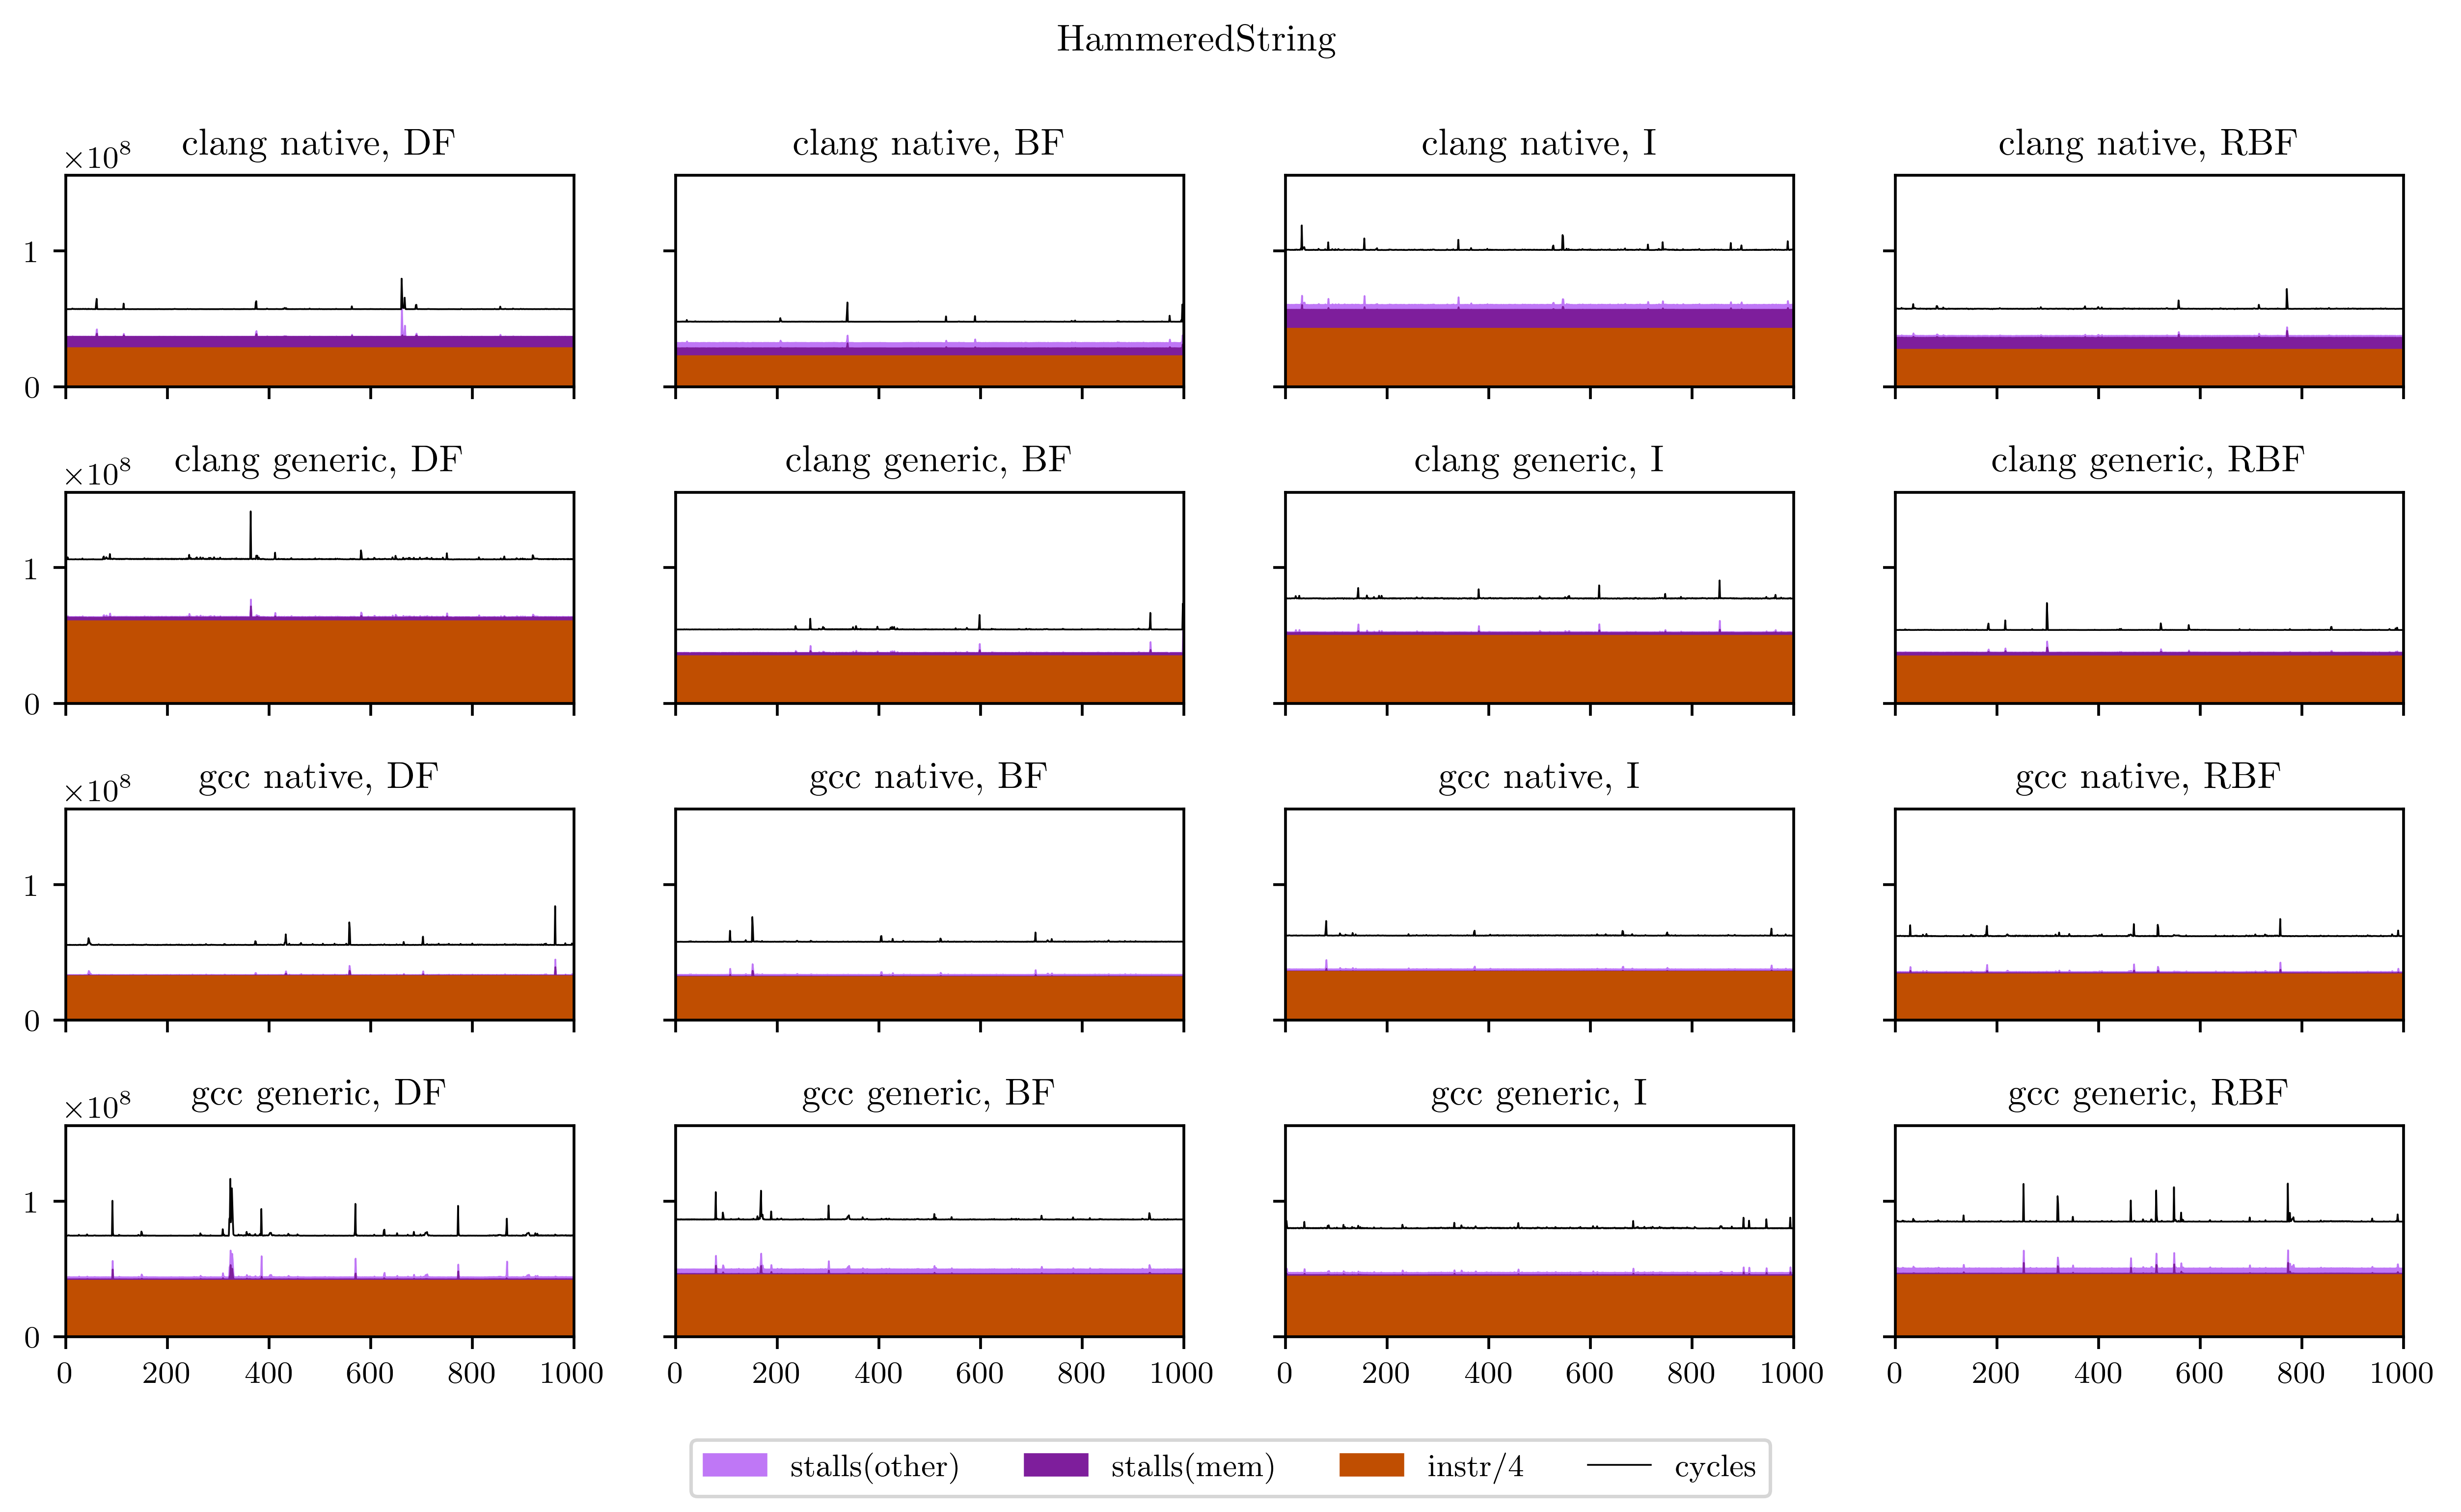
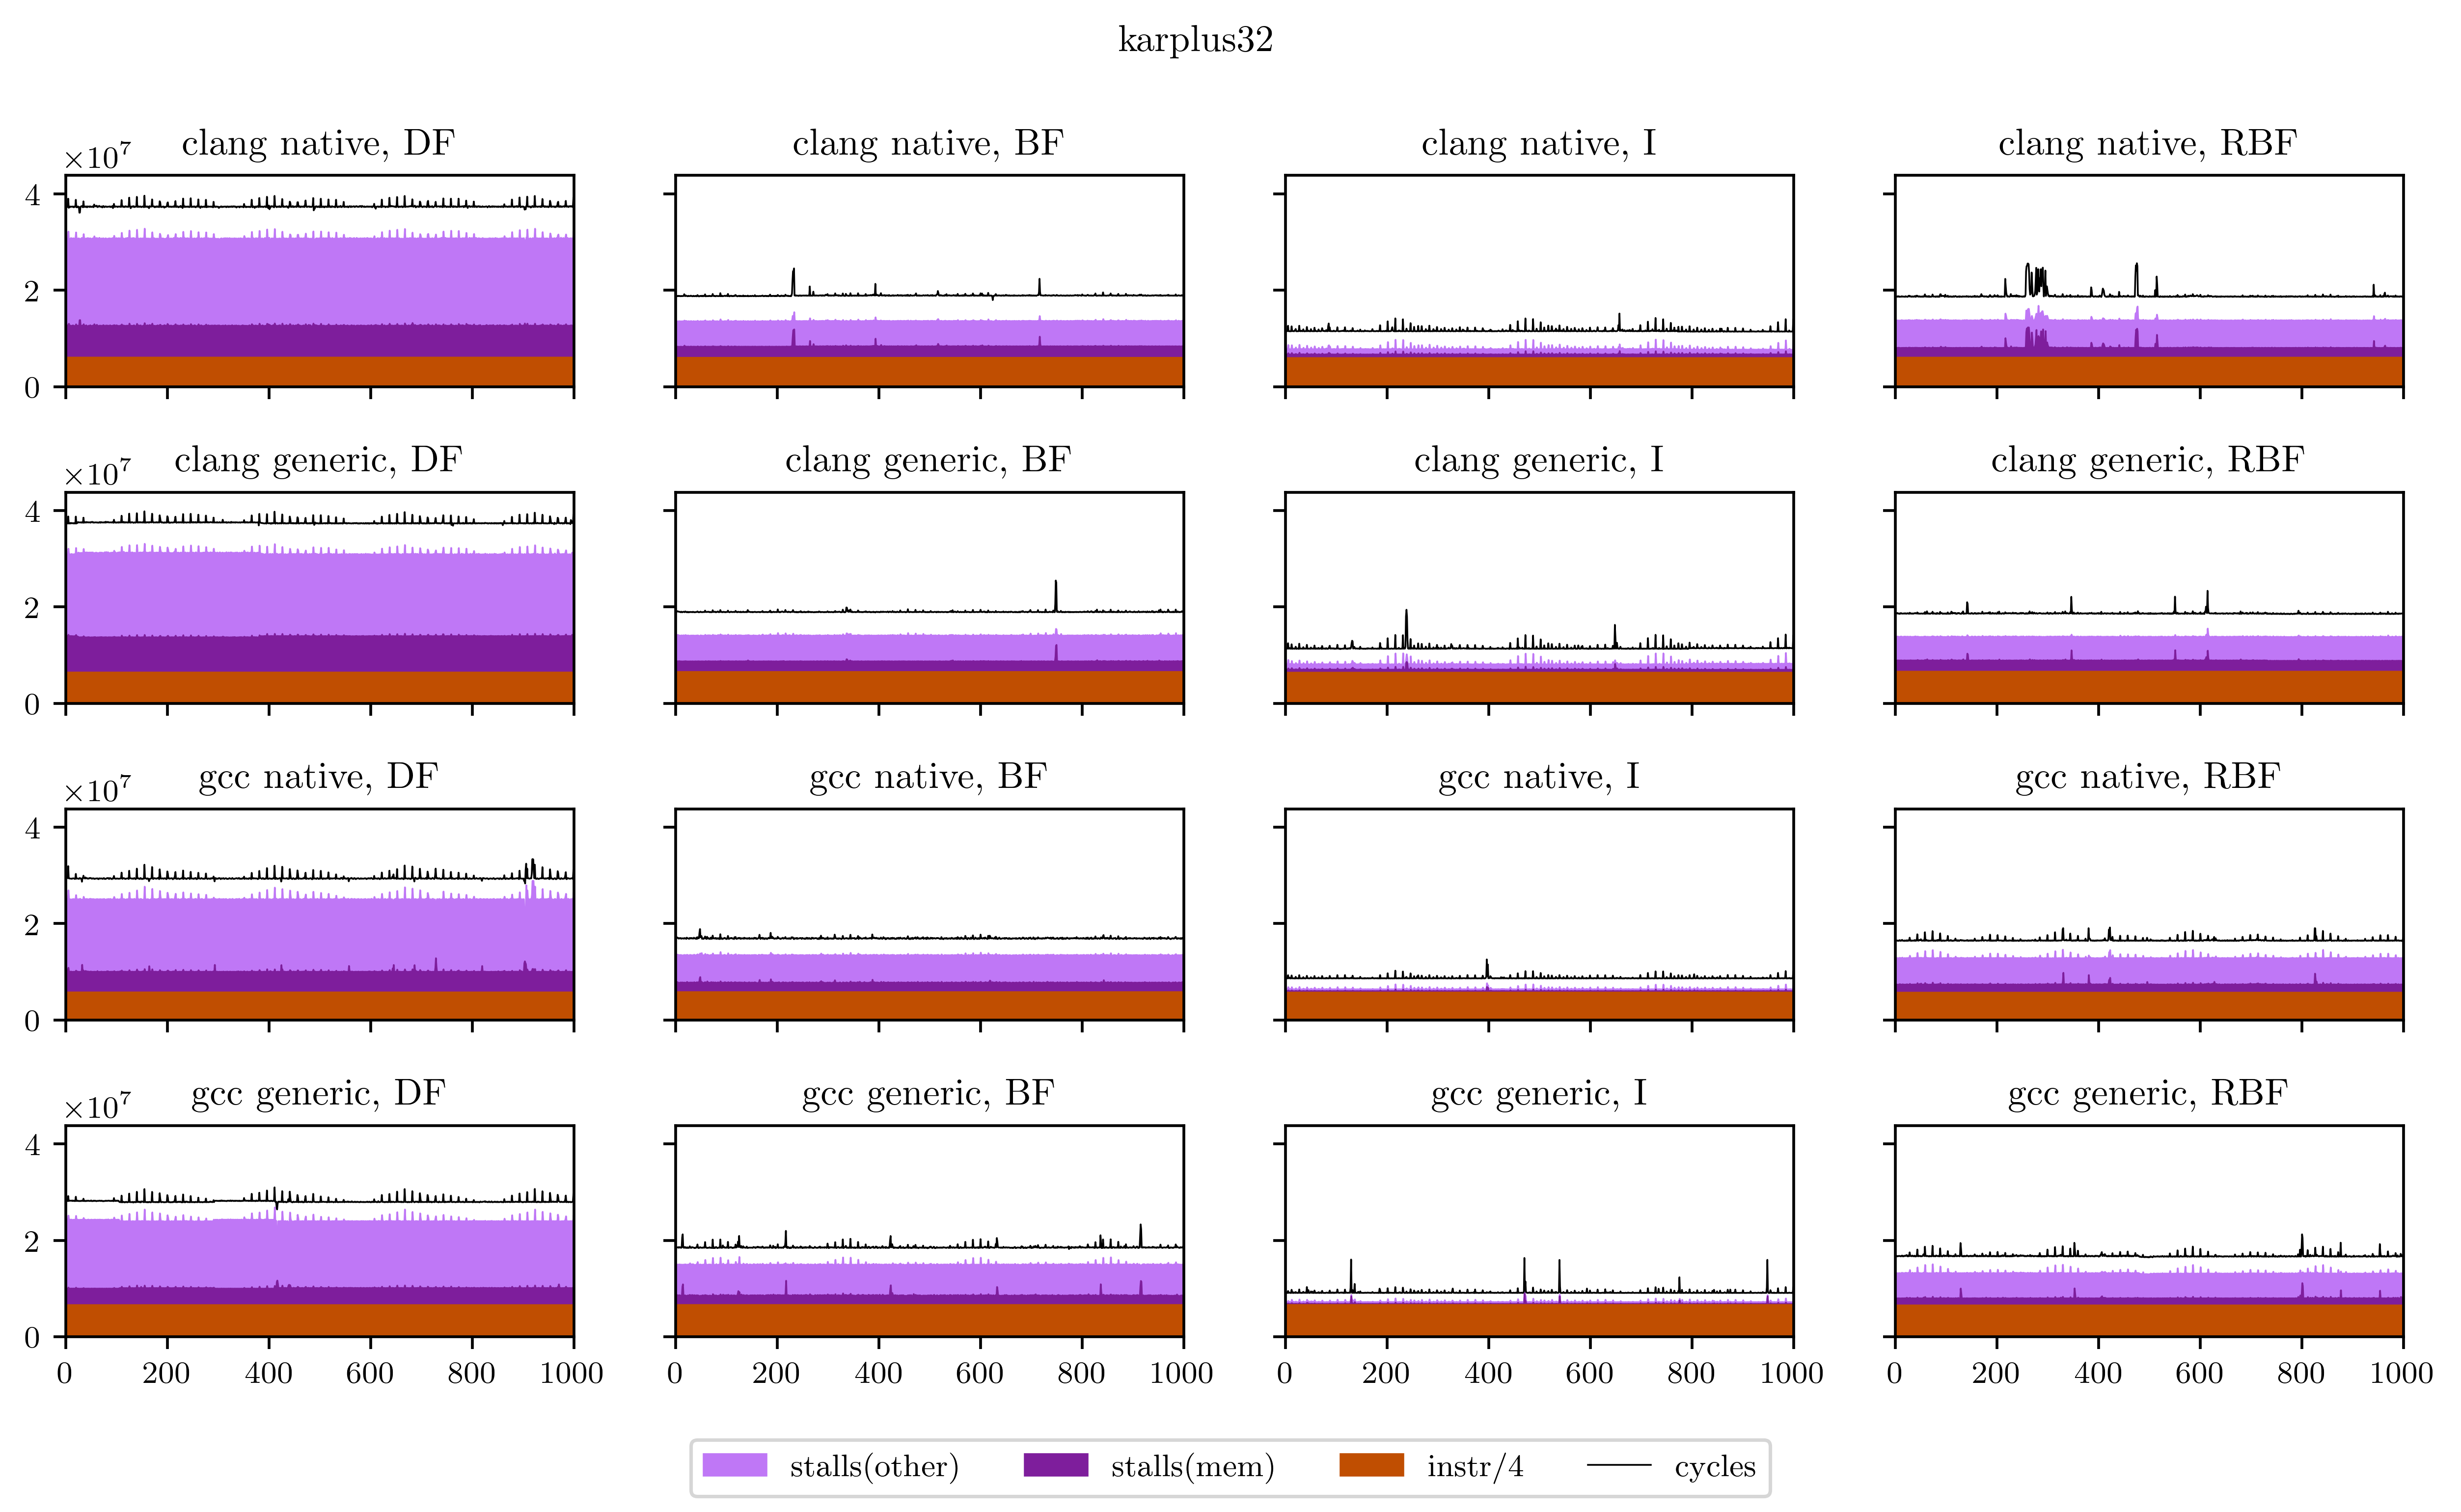
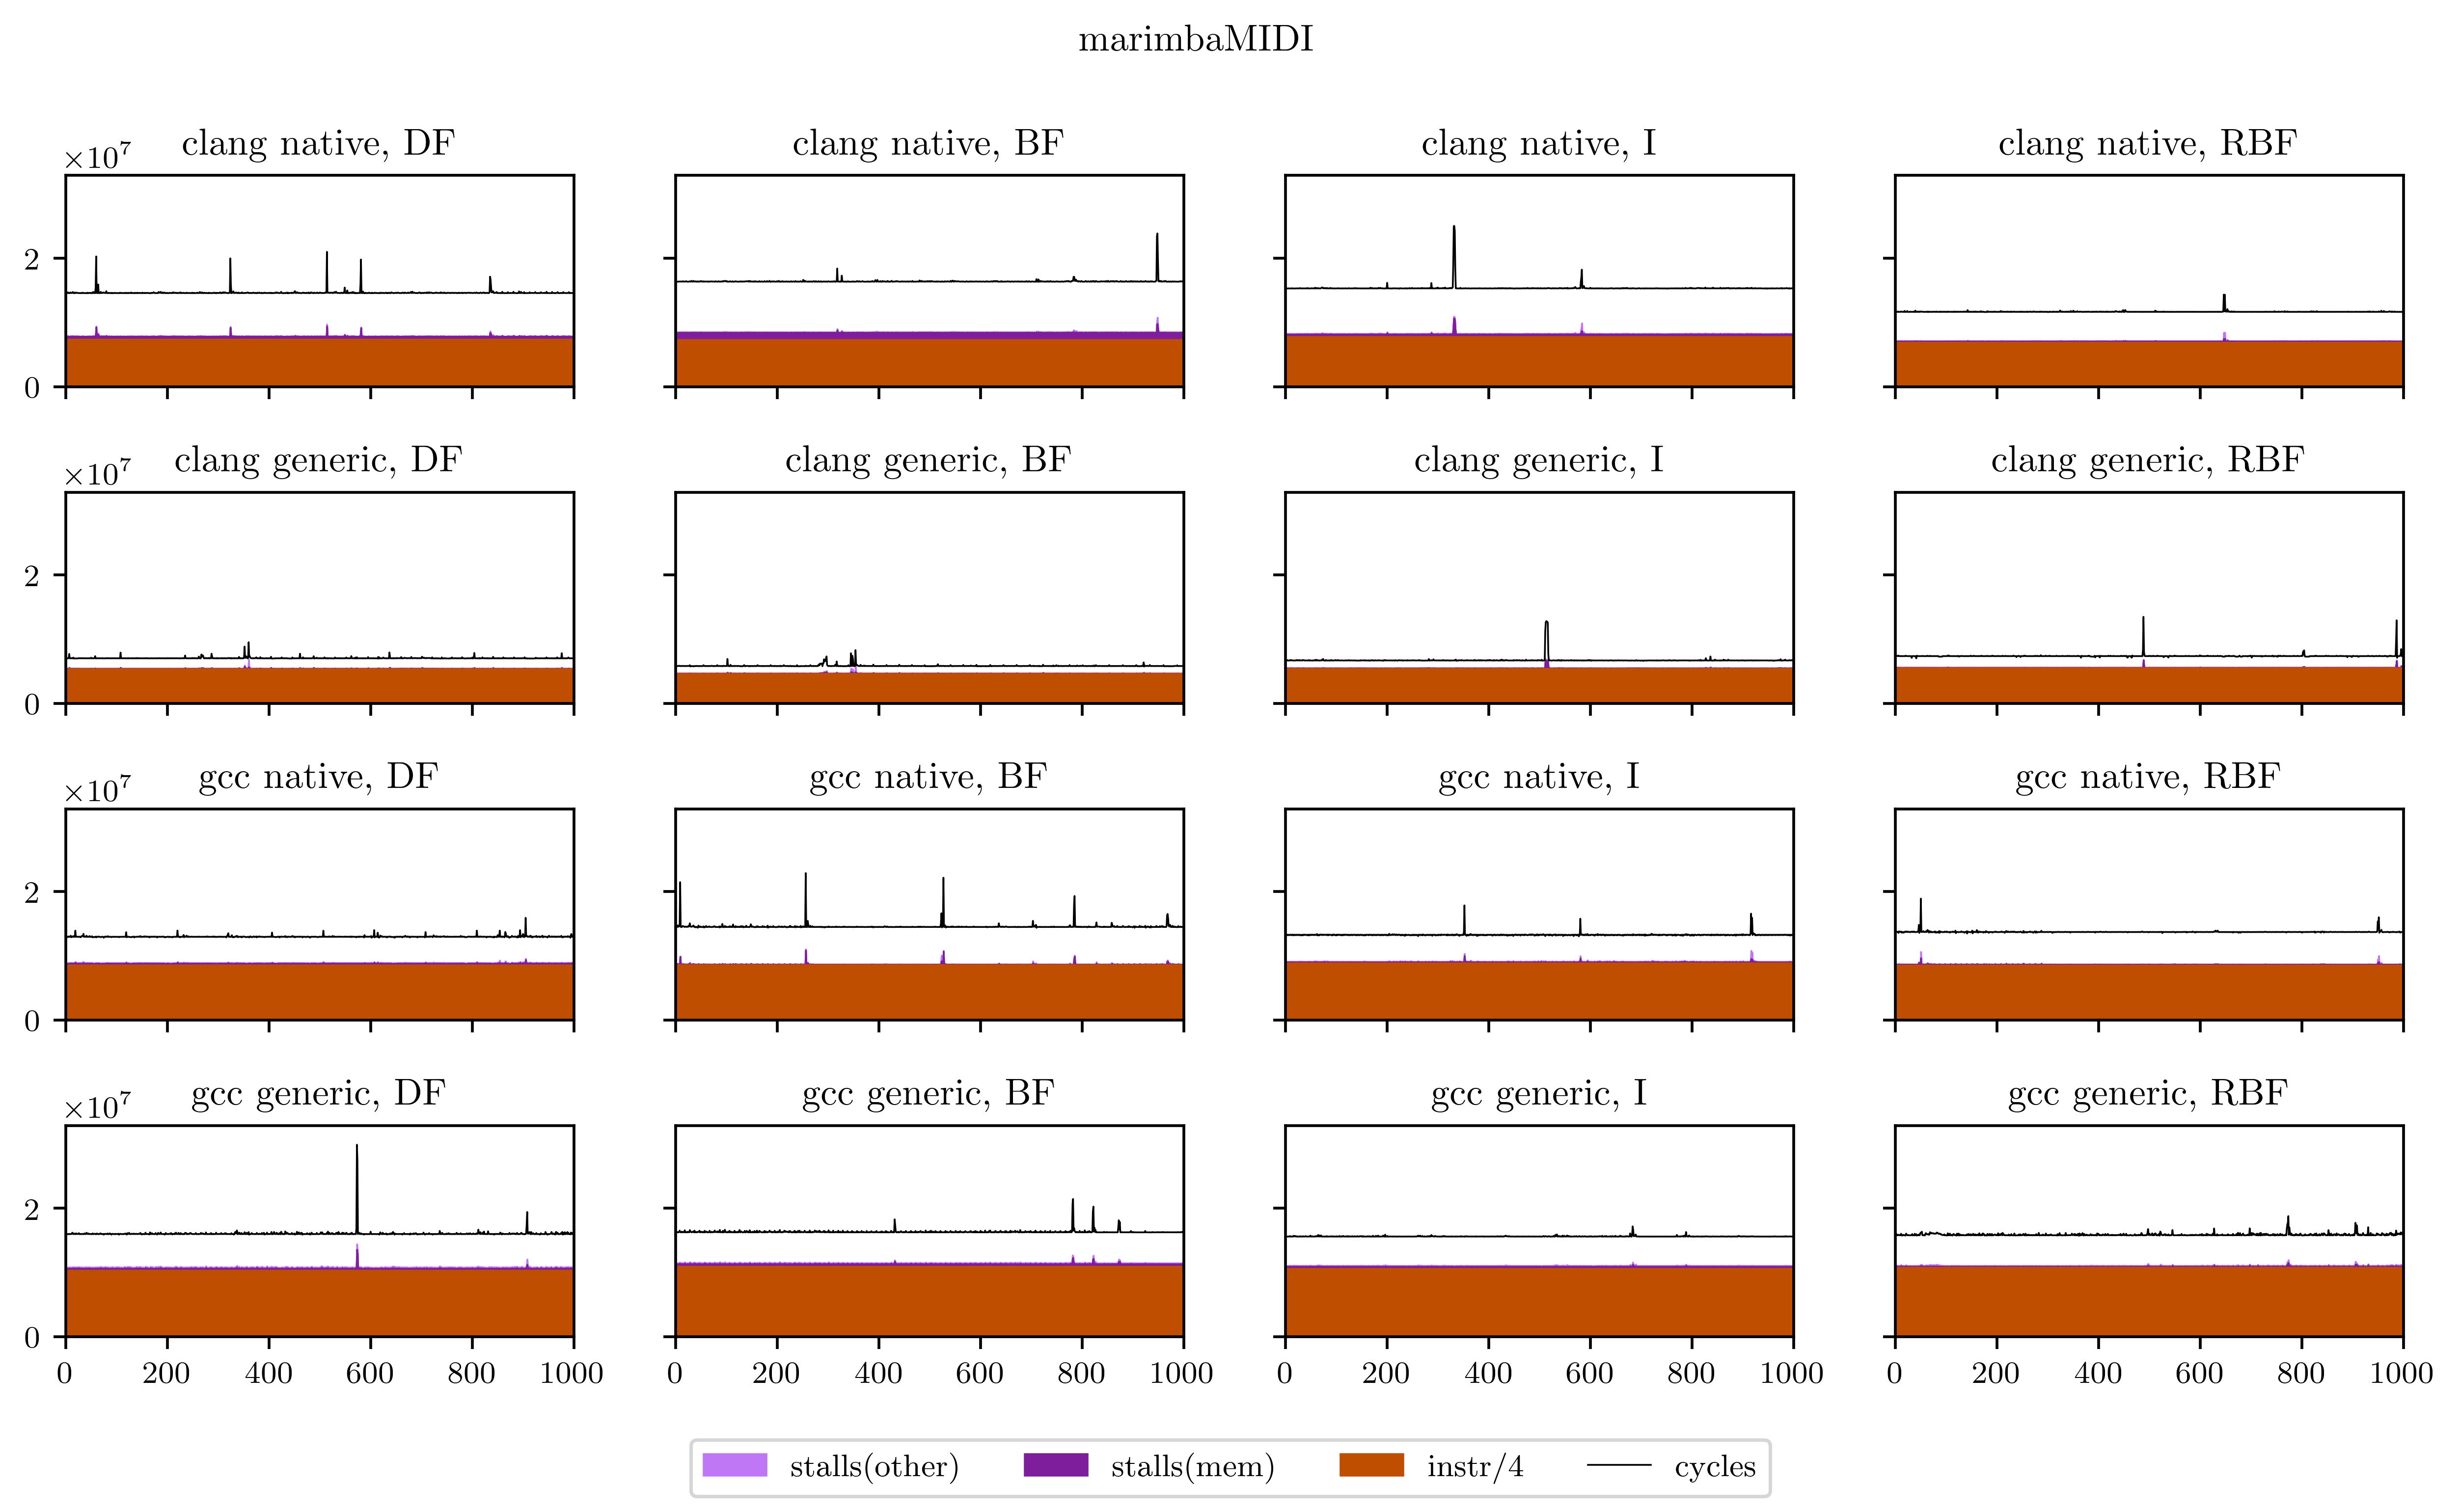
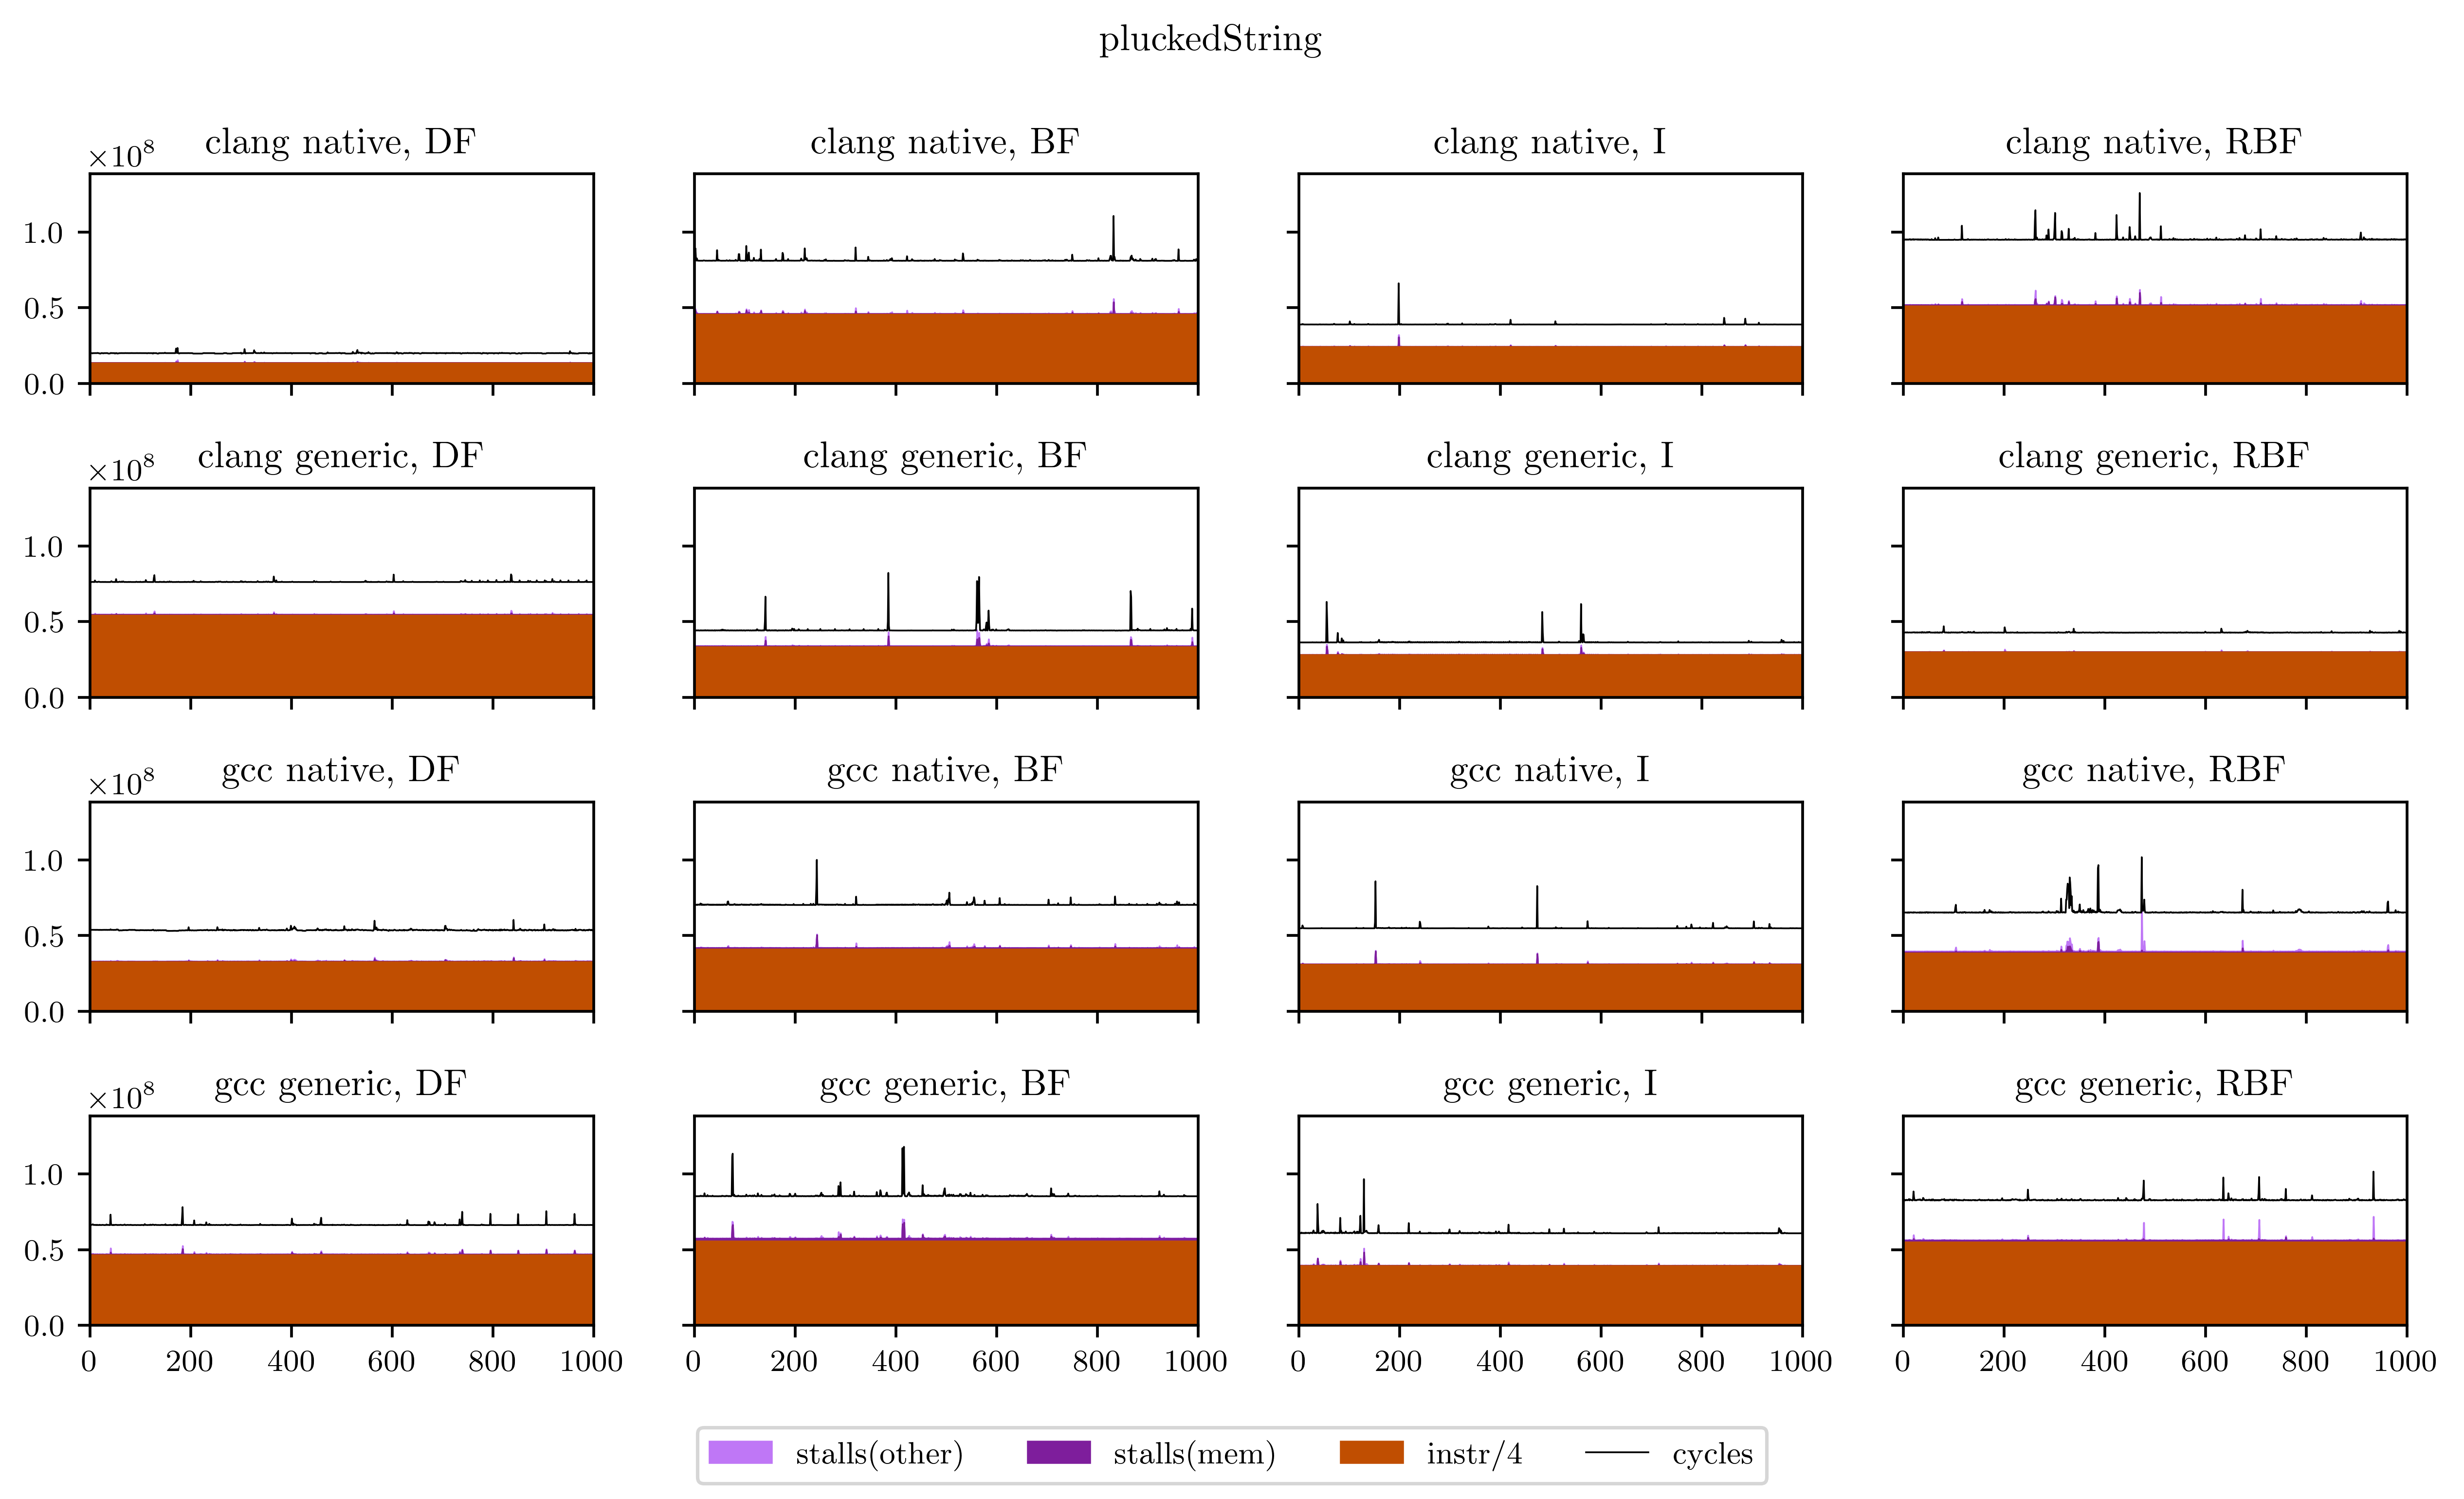
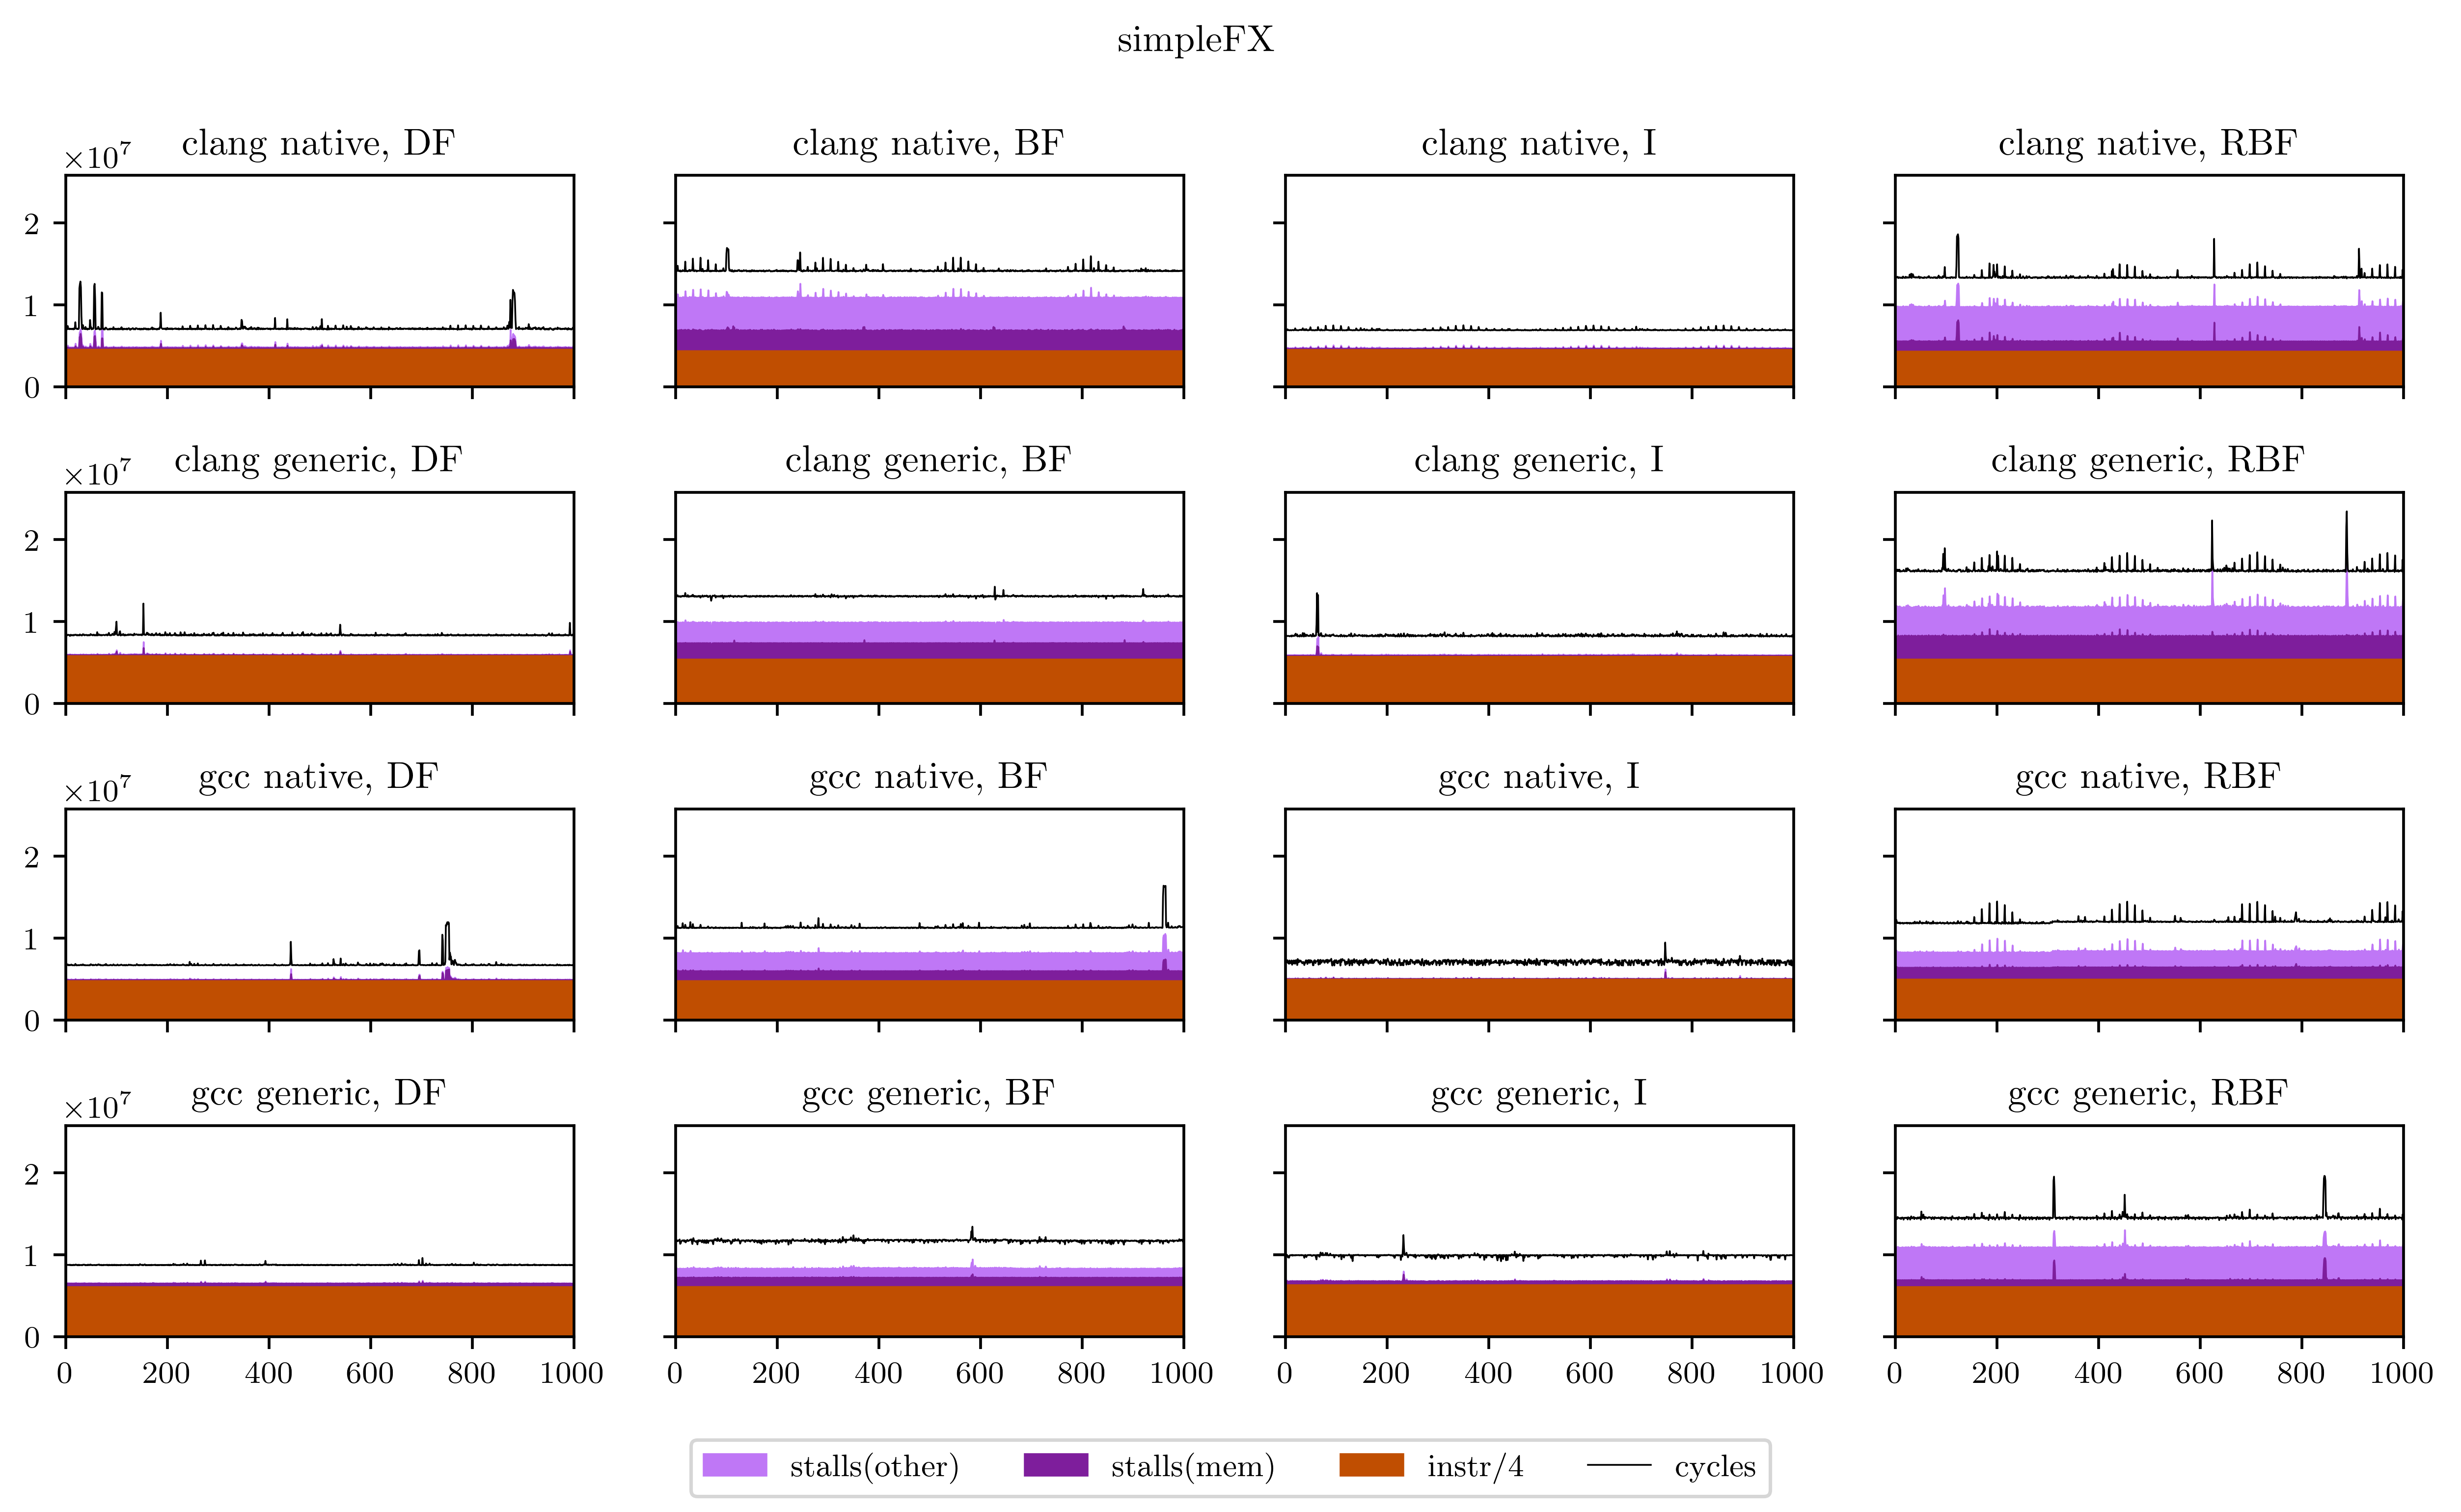
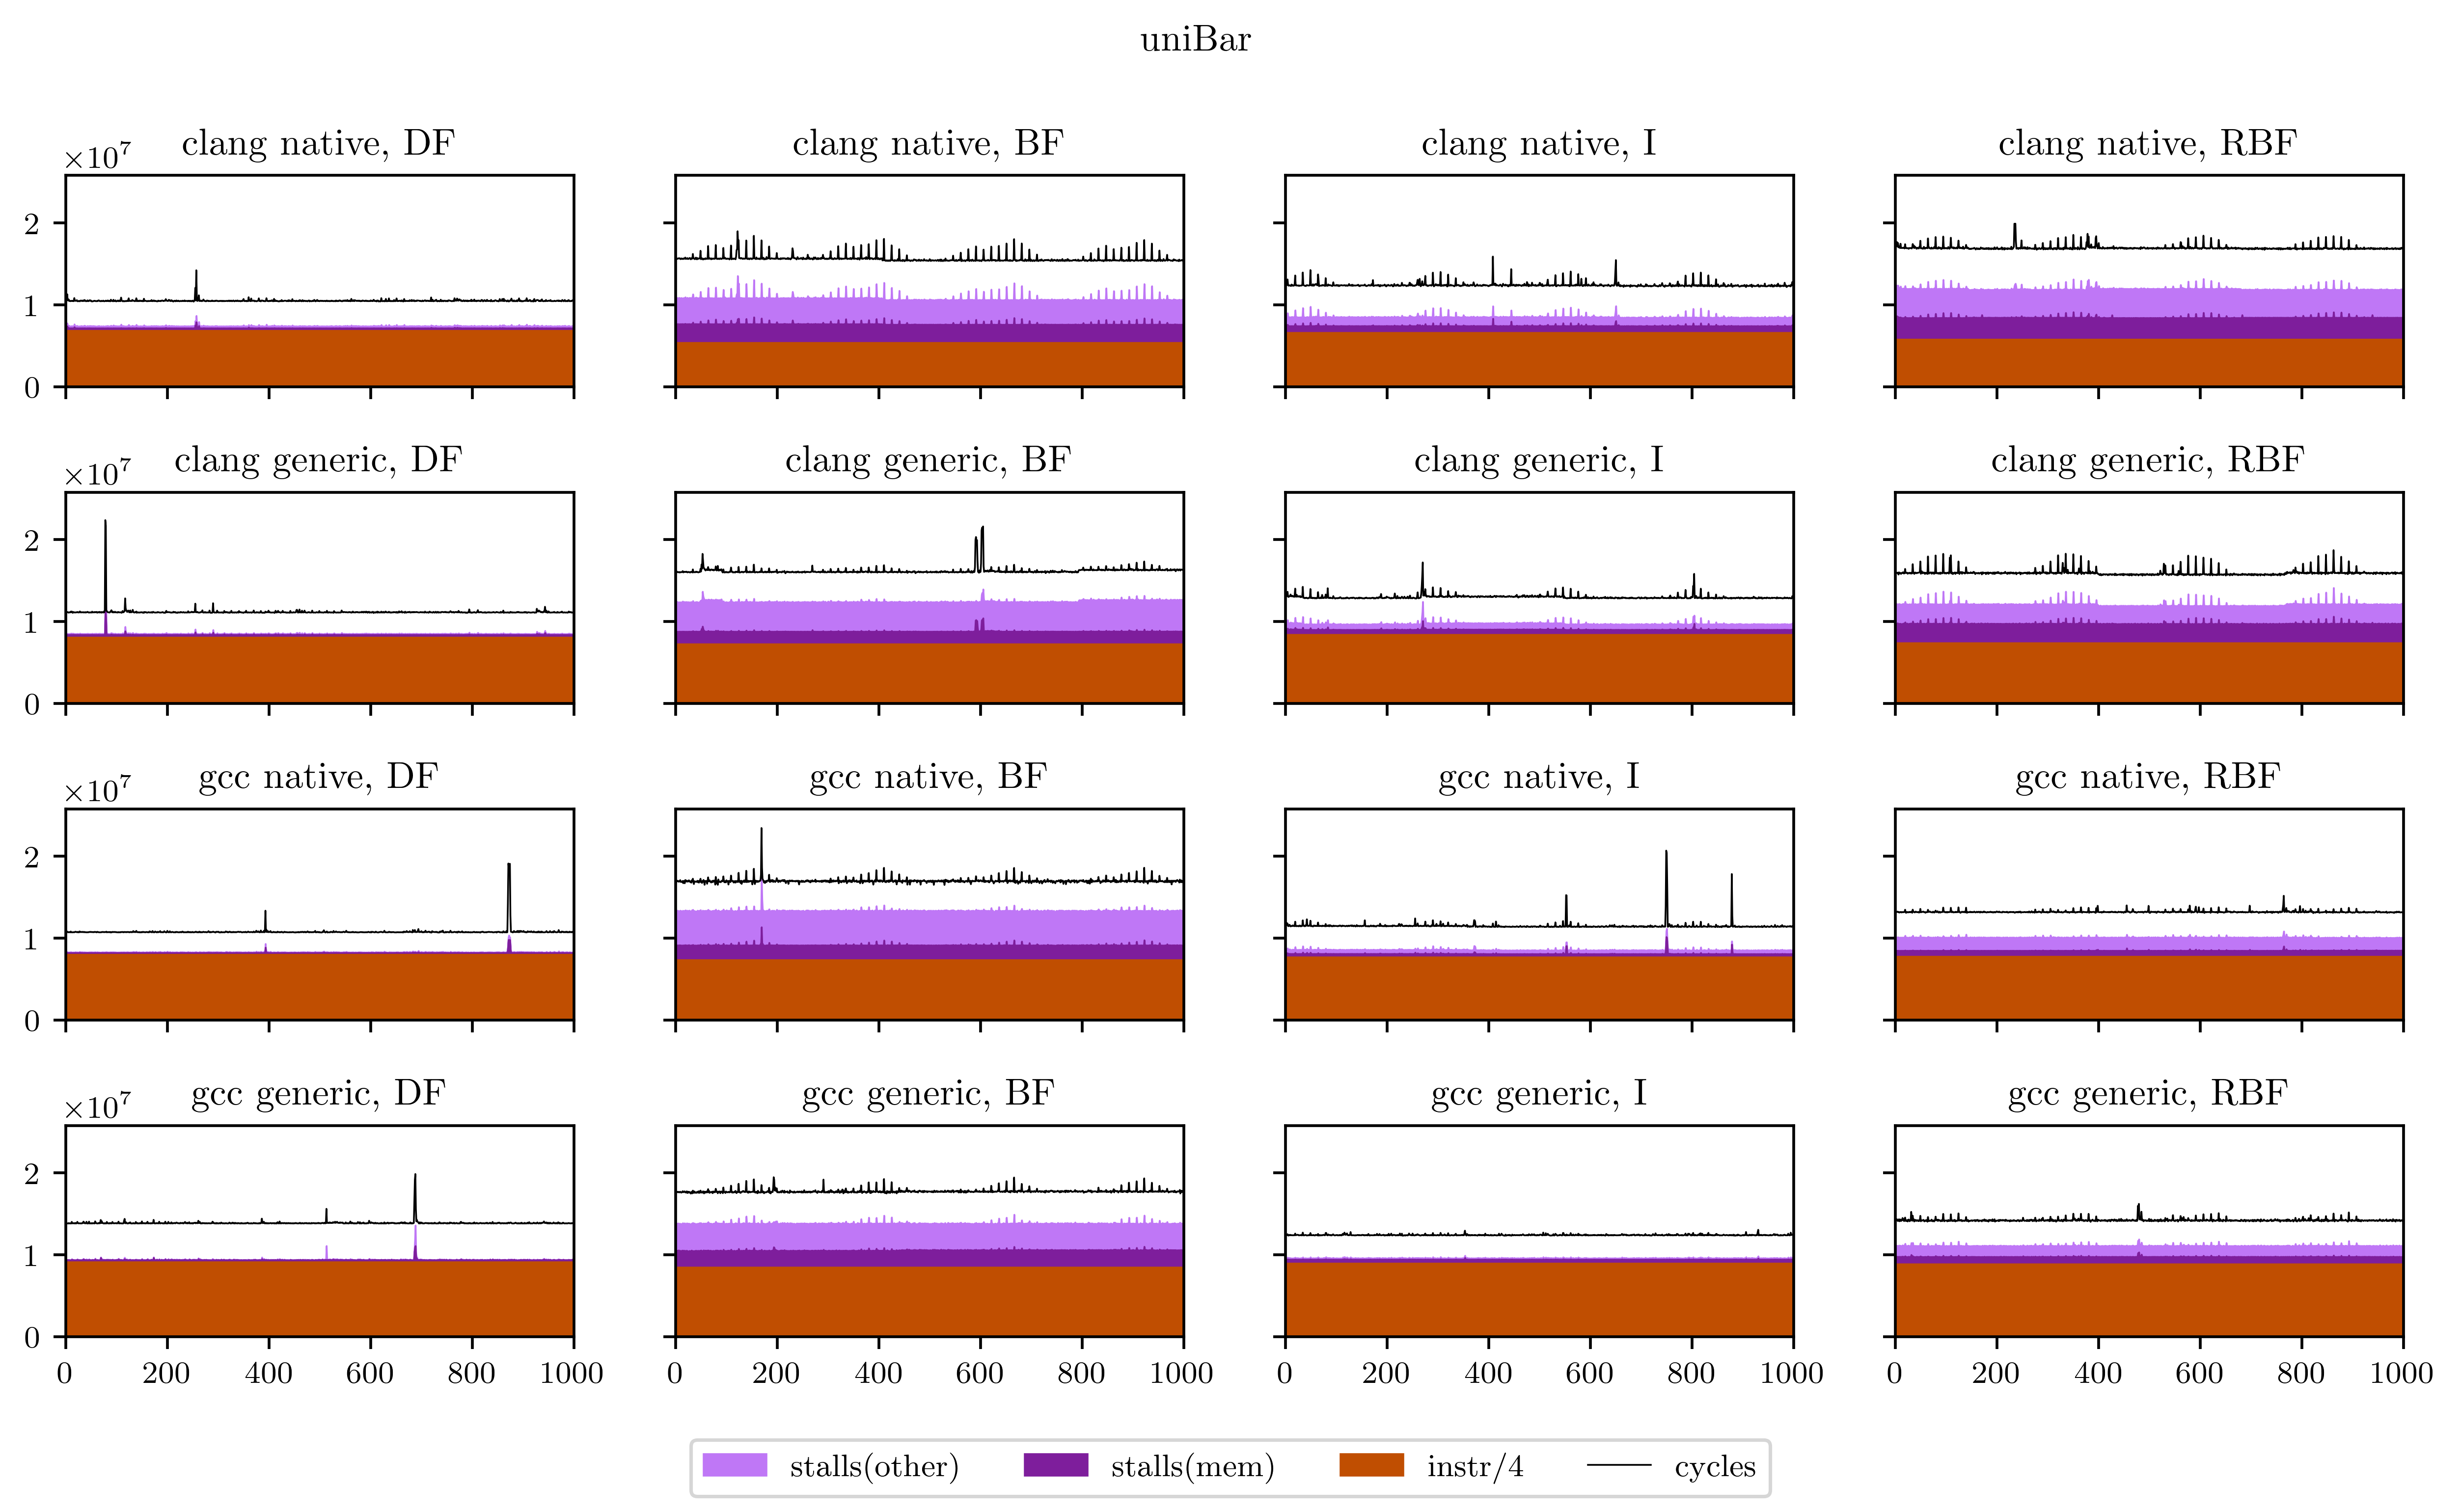
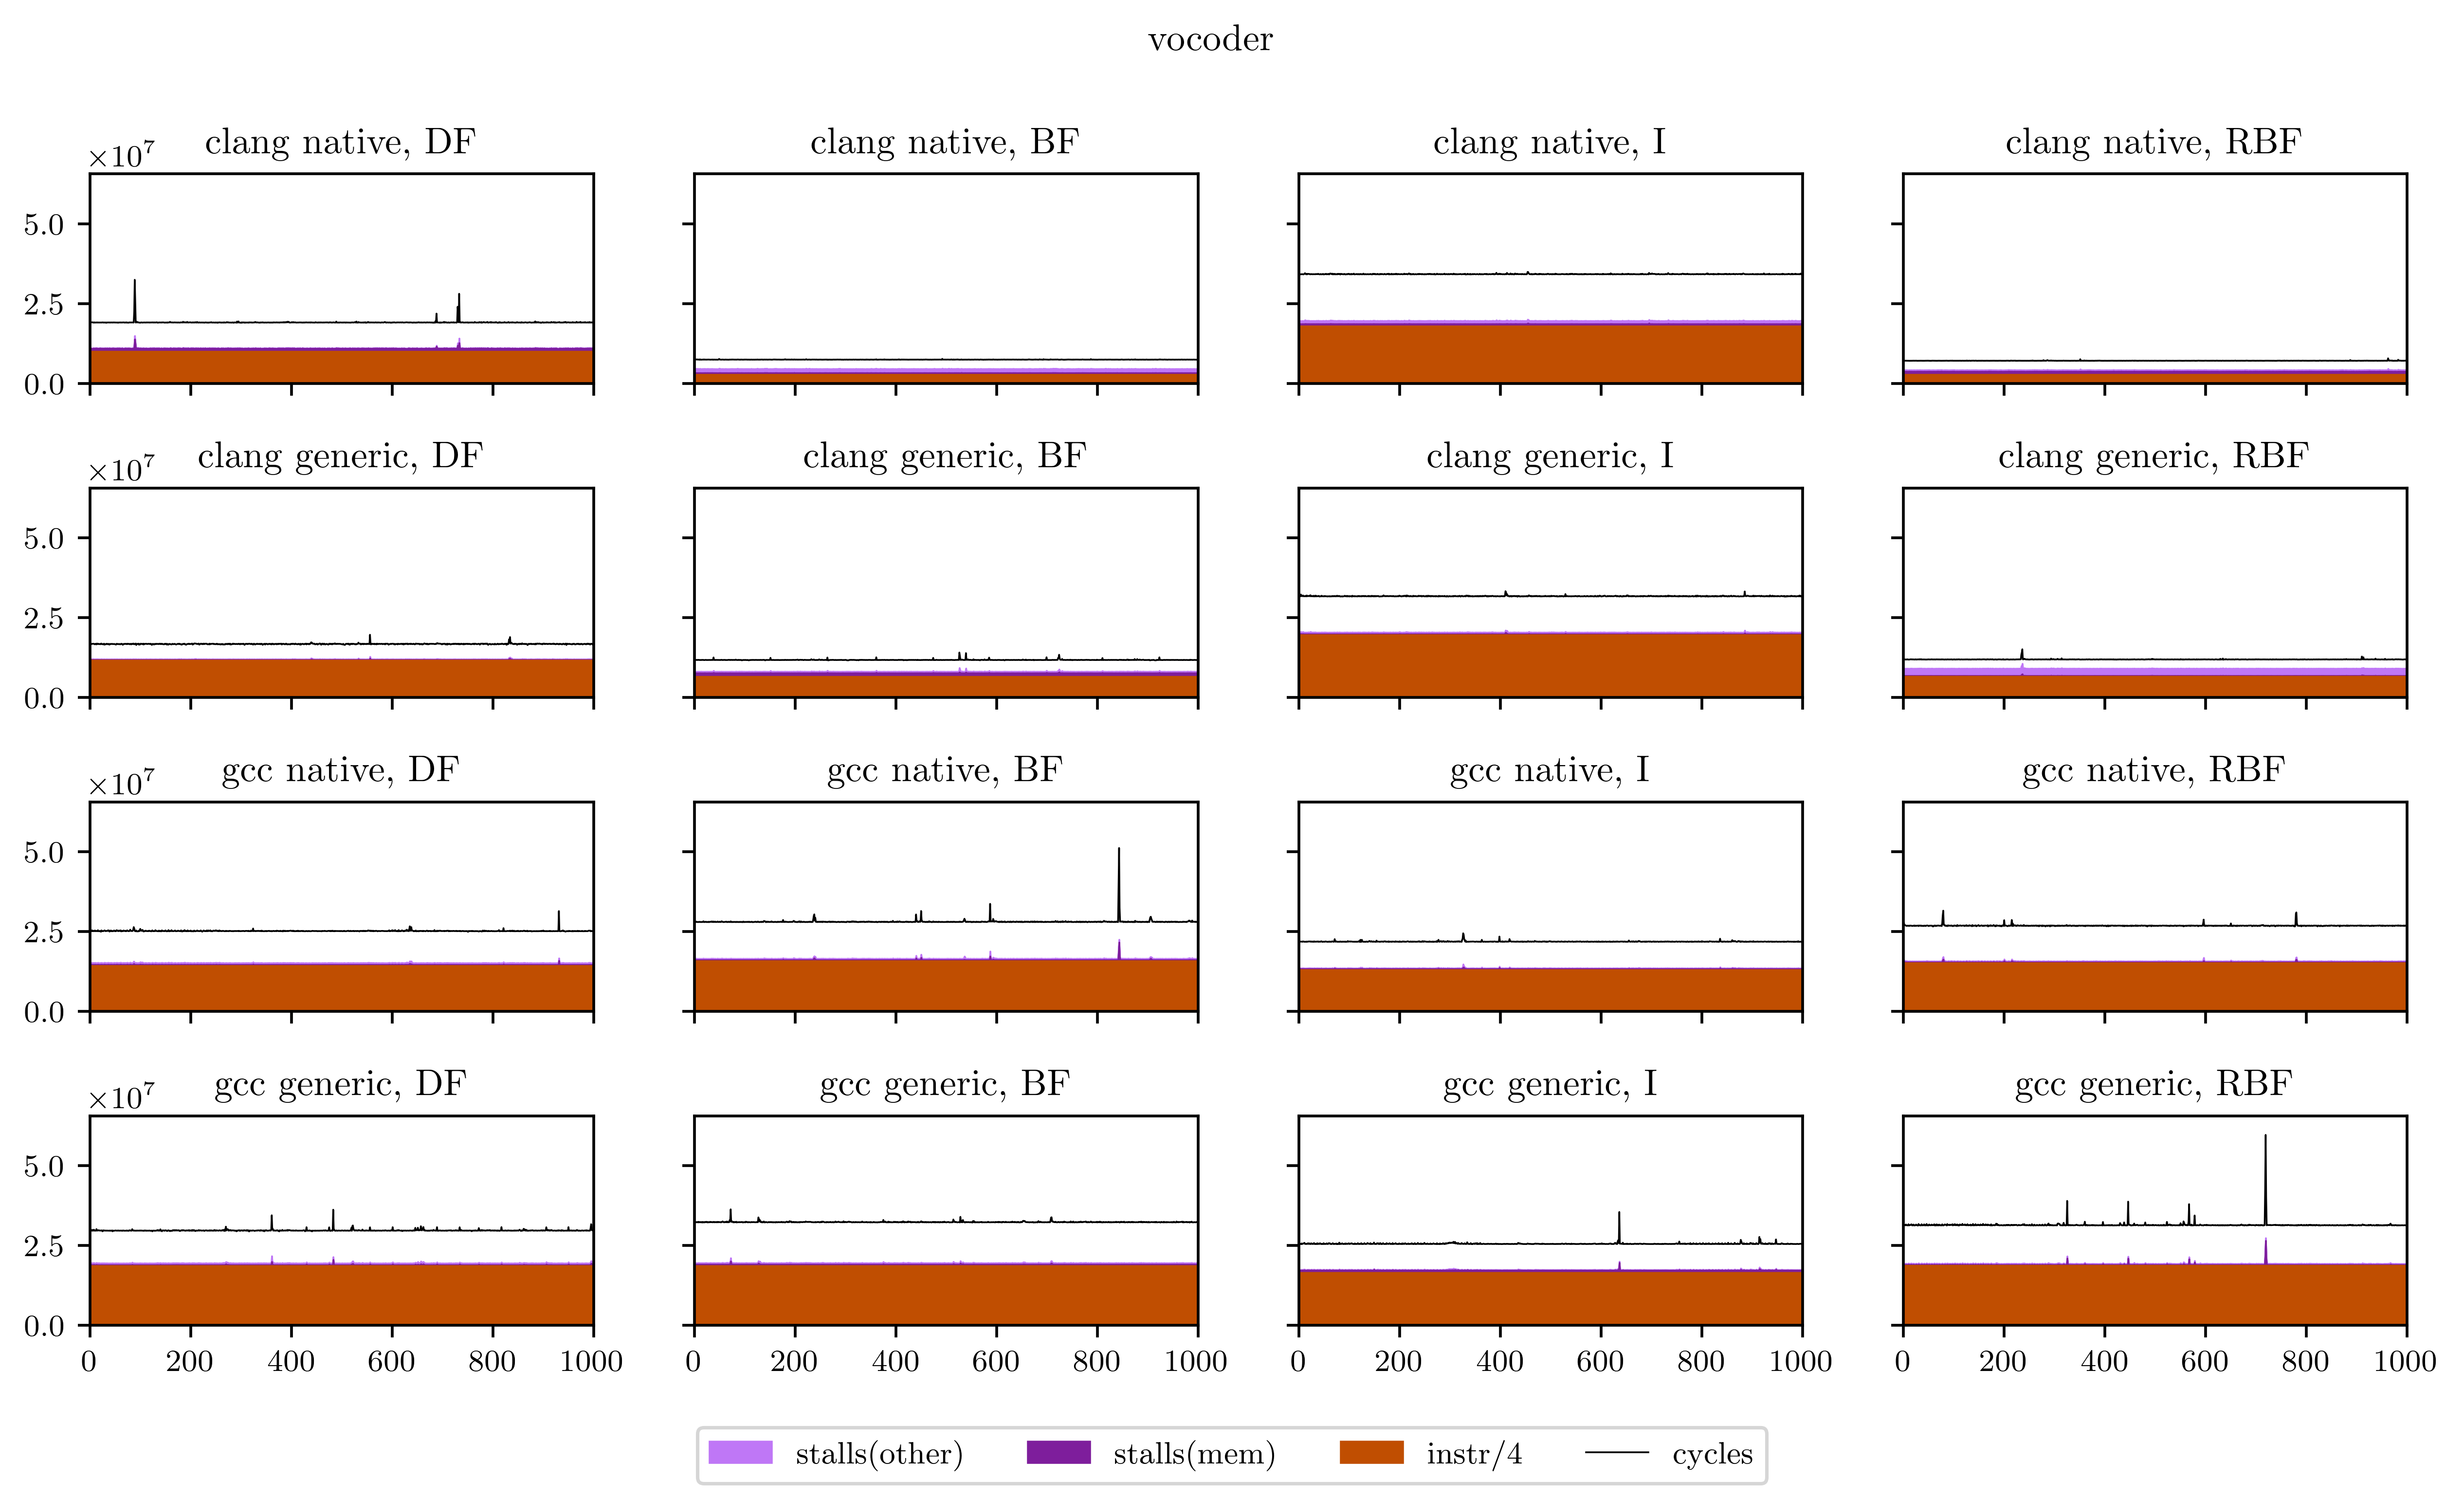
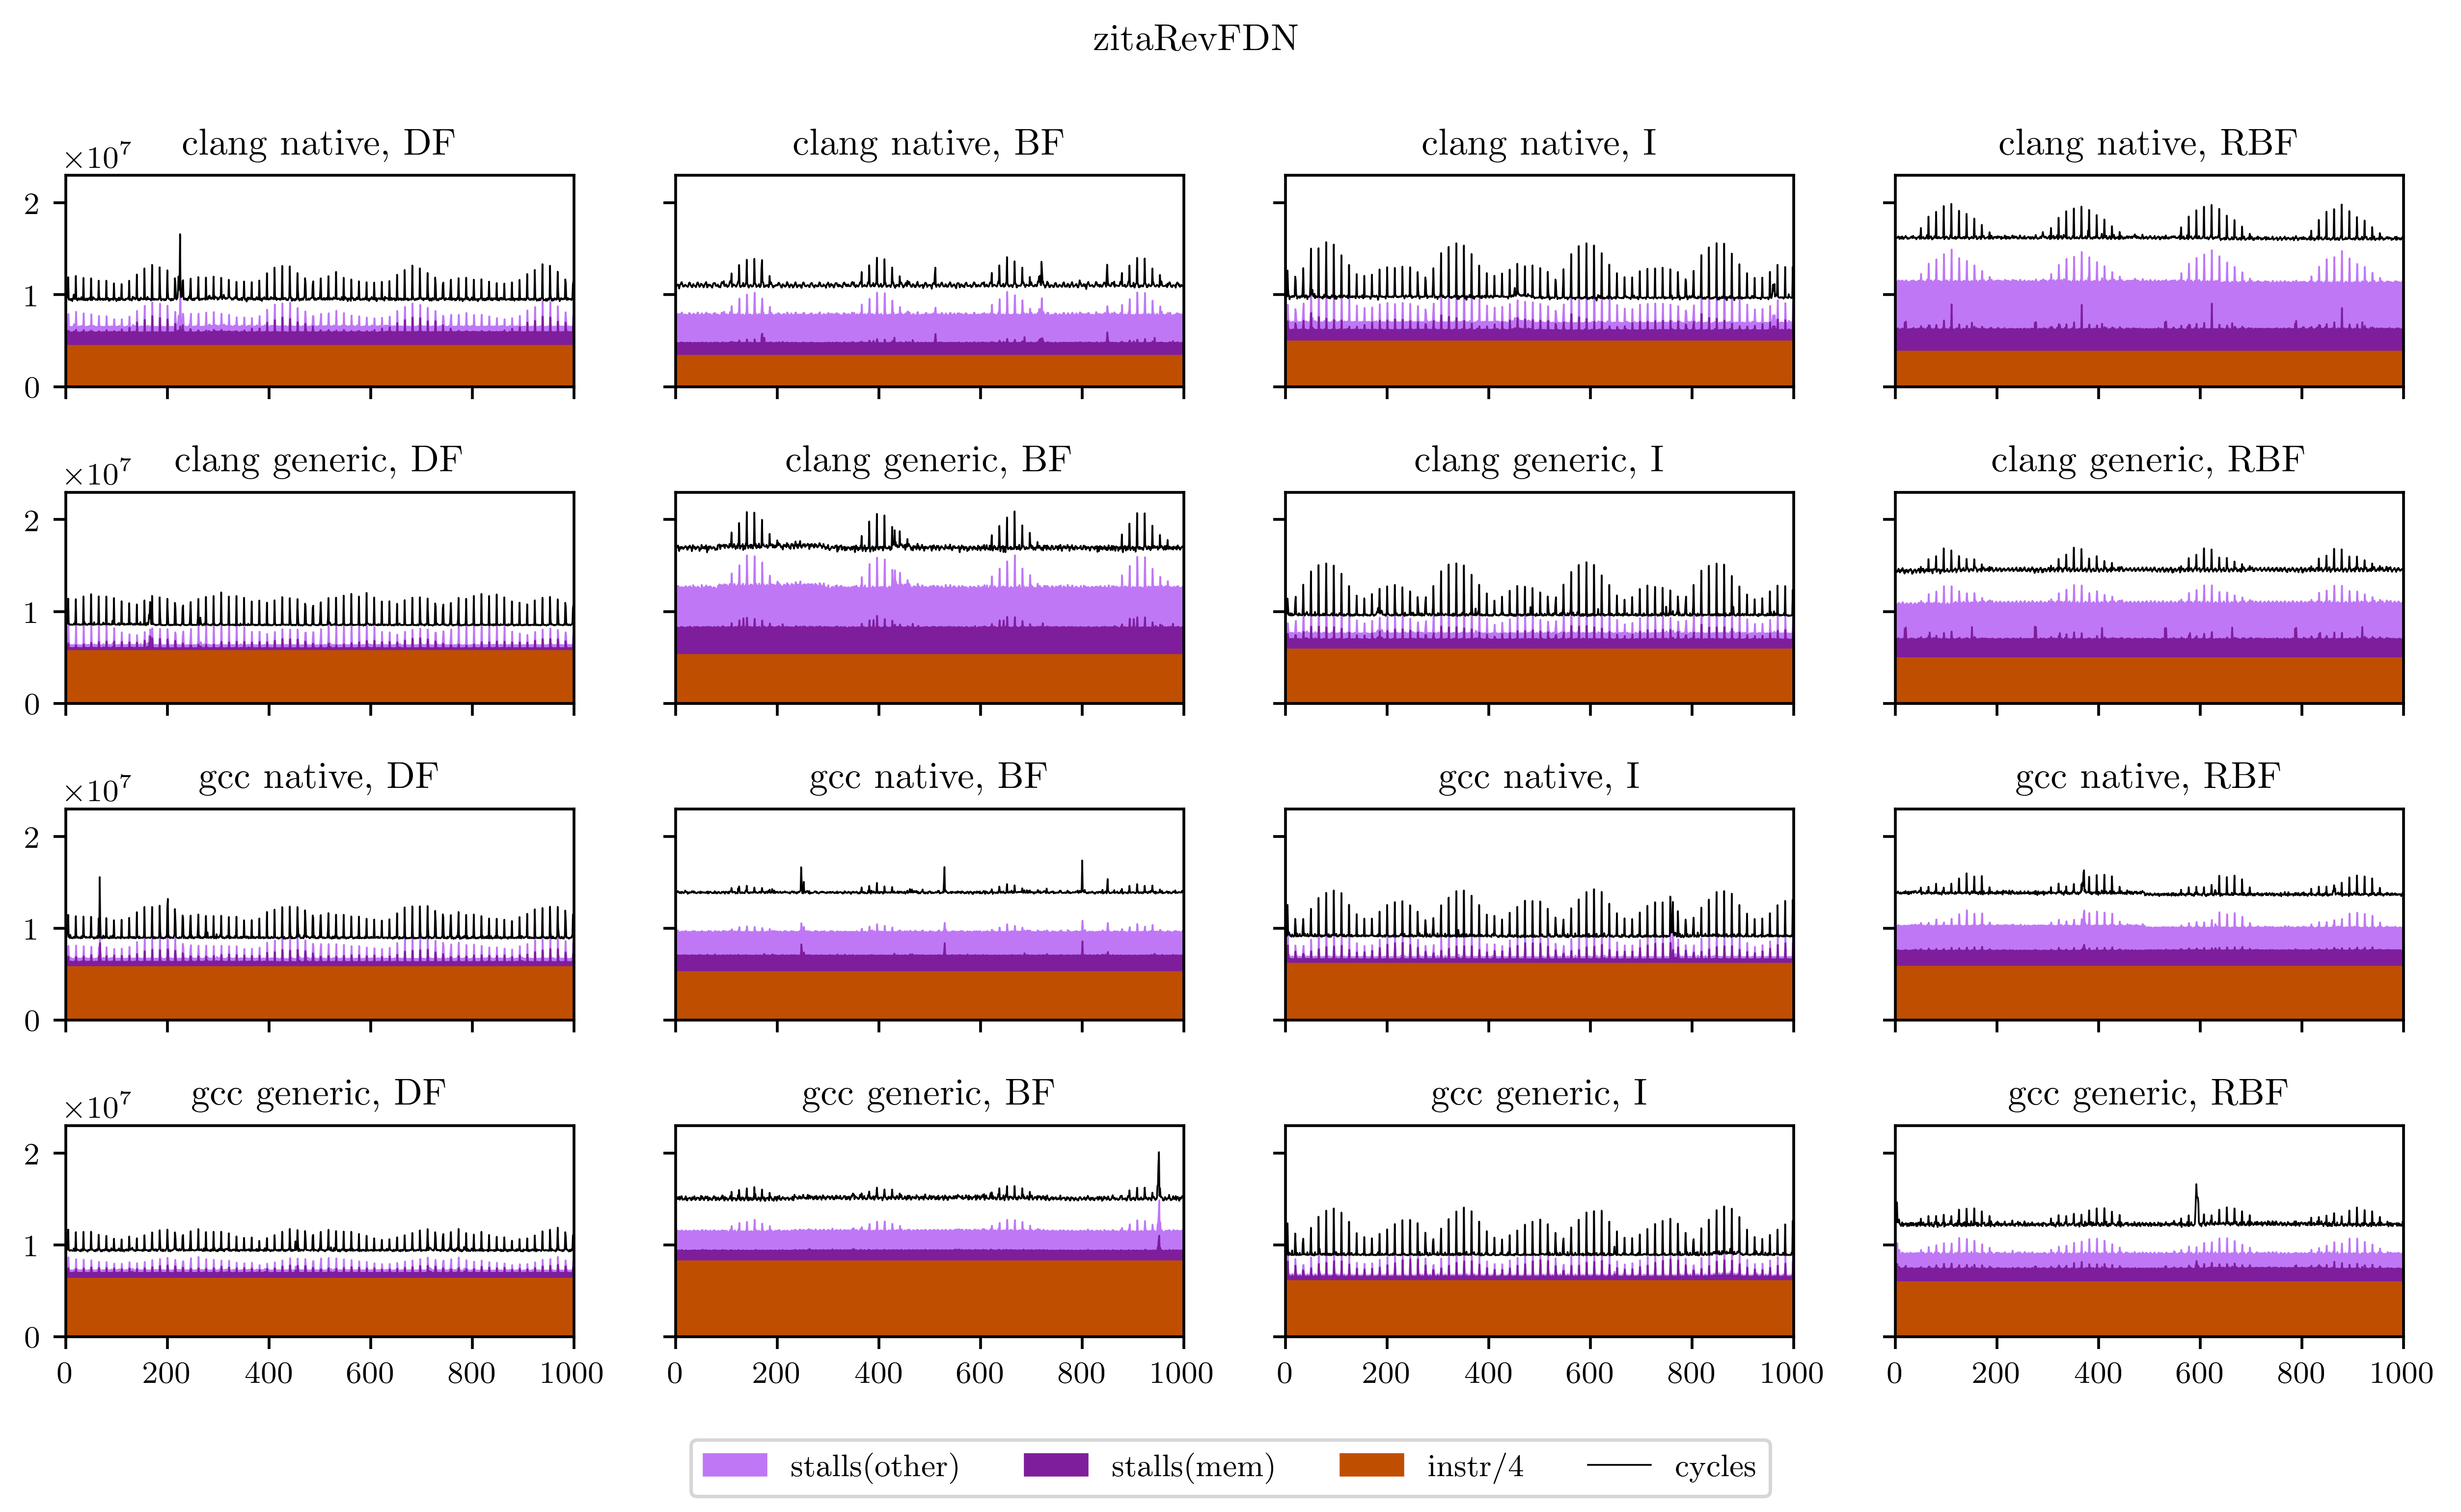
What we found
Finally, I will leave you with all the figures I obtained using this method. Usually the breadth-first strategies have better vectorization and worse memory performance, but you will see that it's not always the case.
References
-
Yann Orlarey, Stéphane Letz, Dominique Fober, Romain Michon: A new intermediate representation for compiling and optimizing Faust code. International Faust Conference, December 2020. ↩
-
Denis Bakhvalov: Performance Analysis and Tuning on Modern CPUs, chapter 3. Independently published, 2023. ↩